

Notes
Editing and updates are complete except for the updated National Crime Victimization Survey, which should be out soon, possibly after the midterm elections.
New FBI crime statistics are incorporated. See https://www.crimeinamerica.net/fbi-records-historic-drops-in-reported-crime-in-2025-why/.
Last Edit: October 1, 2026. I will use specific dates until the National Crime Victimization Survey data are updated.
THE CRIME BRIEFING BOOK
I created briefing books on crime and other aspects of the justice system throughout my career for a President, agency heads, and politicians.
The goal is simplicity by putting all relevant data in one document, something people can use before media interviews, public or legislative/executive branch testimony.
A list of contents is below, allowing readers quick access to sections of interest.
Some readers want detail as to the long-range crime data offered on pages 13 and 14 at the end of this document. Links are included.
Suggestions and corrections are welcome. Readers found earlier versions to be too long. It’s been considerably shortened.
Quotes
Crime stats don’t lie, but they don’t tell the whole truth either.
Understanding crime and justice operations takes exposure to multiple sources, the purpose of this document.
Counting crime is like the Wild West of sociology. Anyone can make any claim they want about crime using USDOJ and additional authoritative data.
Summation
The latest FBI data for 2025 have been added.
The latest 2024 summary from the National Crime Victimization Survey (NCVS) is included. 2025 data will be available soon. This document will be complete once NCVS data is incorporated.
The latest data on fear of crime from Gallup and other sources is included.
The FBI constantly offers updates on reported crime data on its main site.
The Bureau of Justice Statistics offers findings from its National Crime Victimization Survey once a year in late summer or early fall.
Crime Summations
Extended Summations for US Crime From 2021-2026 via The FBI and National Crime Victimization Survey Are On Page 5.
Brief and Extended Summations of Crime Data By Year (2012-2026) via the FBI and National Crime Victimization Survey are on pages 13-14.
Podcasts
Hear a podcast on YouTube. The podcast includes data from the National Crime Victimization Survey from 2024 and the FBI data for 2025.
Evaluations Of This Site
Crime in America.Net– ChatGPT’s “Top 10 Sources for Crime in America” based on primary statistical sources with trusted secondary analysis.
100 out of a possible 100 score based on website trust, content, and links, Gridinsoft.com and ScamDetector.Com.
Overview
A comprehensive, reader-friendly, layperson-based overview of crime with a focus on violent crime in the United States.
I try to respond to most user questions in a single document; a wide variety of topics are covered.
The main complaint I get from justice system practitioners and the media is the requirement that they go through dozens of documents to answer questions. I attempt to answer most crime and justice questions here.
Summaries of yearly sources/links are included for FBI and National Crime Victimization Survey statistics, along with additional authoritative data.
Keywords: Crime, violent crime, crime rates, crime statistics, violence, crime in the United States, crime in the US, crime in America, crime research, FBI, National Crime Survey, National Crime Victimization Survey, Bureau of Justice Statistics, Gallup, criminology.
Author
Leonard Adam Sipes, Jr.
Thirty-five years of explaining crime data while directing multi-award-winning public relations for national and state criminal justice agencies.Retired federal senior spokesperson. Interviewed multiple times by every national news outlet.
Former Senior Specialist for Crime Prevention for the Department of Justice’s clearinghouse. Former Director of Information Services, National Crime Prevention Council. Former Adjunct Associate Professor of Criminology and Public Affairs-University of Maryland, University College.
Former advisor to presidential and gubernatorial campaigns. Former advisor to the “McGruff-Take a Bite Out of Crime” national media campaign. Certificate of Advanced Study-Johns Hopkins University. Former police officer.
Author of ”Success With The Media: Everything You Need To Survive Reporters and Your Organization” available at Amazon and additional bookstores.
Please sign up for future articles on the front page of this website.
A Layperson-Friendly Summation And Analysis of Crime And Fear of Crime Data for Recent Years
My Background:
I summarized crime and justice issues for reporters, dignitaries, and practitioners while working for two US Department of Justice agencies: the National Criminal Justice Reference Service (senior specialist for crime prevention and statistics) and the National Crime Prevention Council (director of information services). I created briefing books for the advertising team managing the McGruff-Take A Bite Out Of Crime) award-winning national media campaign.
I offered overviews of crime and criminal justice topics to every national and international media source for 35 years as a director of public information for state criminal justice agencies and the national entities cited above.
I take the complicated topics of crime and justice and offer observations and research summaries that the non-criminologist can understand based on my decades of academic and criminal justice experience, including six years in law enforcement.
There is significant intricacy when discussing crime statistics. Analyzing crime becomes complex because readers need to go to multiple (sometimes conflicting) reports to understand primary sources.
Principal Crime Sources
There are reputable sources for crime in the United States, but two are primary: crimes reported to law enforcement compiled by the FBI, and the National Crime Victimization Survey from the Bureau of Justice Statistics. Both are US Department of Justice Agencies. More on both is below.
Links For The Latest National Full-Year Primary Crime Reports (2025) From the FBI and the National Crime Victimization Survey
National Crime Victimization Survey-2014 (latest full-year report)
FBI (latest 2025 full yearly report)
A more readable crime narrative from the FBI for 2025 is available here.
A Summation Of Violent Crime For Recent Years
If you’re looking for a summation of violent crime in the United States for recent years, here’s my analysis: There were record increases in rates of violent crime via the USDOJ’s National Crime Victimization Survey in 2022 (44 percent), and rates of violent crime remain high (essentially unchanged) in yearly official reports for 2023 and 2024 (latest report).
Reported violent crime numbers offered by the FBI decreased approximately 3 to 4.5 percent in 2023 and 2024 in yearly official reports. It decreased by 9.3 percent in 2025. Decreases continued in 2026; see here.
Independent sources state that reported urban or city violent crime numbers have decreased considerably in recent years. In contrast, the National Crime Victimization Survey for 2024 states that violence increased in urban areas.
Information on property crime is summarized below.
Contents
Page 1: Contents of This Report
Page 2: Quick Summaries of Crime Data
Page 3: Context For This Report–What You Need to Understand
Page 4: Property Crime
Page 5: Summaries of Recent Crime Data From The FBI and the National Crime Victimization Survey, 2021-2026
Page 6: Crime Data From City Police Crime Dashboards
Page 7: FBI’s New Method Of Collecting and Reporting Crime Data
Page 8: Explaining The Bureau of Justice Statistics (BJS) National Crime Victimization Survey
Page 9: Groups Impacted By Crime
Page 10: Fear of Crime
Page 11: Fraud, Identity Theft and Cybercrime
Page 12: Crime Data from Gallup
Page 13: Brief Summaries of FBI and National Crime Victimization Survey Data By Year
Page 14: Extended Summaries of FBI and National Crime Victimization Survey Data By Year
Page 15: Links To Sources For FBI and National Crime Victimization Survey Data By Year
1.
Quick Summaries Of Crime Data
Detailed crime data is offered on page 5 for 2020-2026, and quick and extended summaries are available for 2012 to 2025 on pages 13-14.
Feel free to skip the context section below and head for the summary crime data cited above.
But understanding crime is highly complex, and context may prove helpful, especially for laypeople and journalists.
2.
Context For The Rest Of This Document
My apologies for the extended context before examining crime numbers.
The National Crime Victimization Survey (NCVS)
Many readers have never heard of the 50-year-old National Crime Victimization Survey from the US Department of Justice, and it’s used extensively throughout this document. It’s a survey to uncover and discuss ALL CRIME, not just reported crime, through the FBI. It provides interesting summaries of related topical data (e.g., who’s victimized, who commits crime, and many other topics).
The US Census and the Bureau of Justice Statistics call the survey the nation’s principal source of crime statistics. See page 8 for a description of the NCVS.
See Millions Of Crimes Are Not Included In FBI Yearly Reports.
The vast majority of what we call crime is NOT reported to law enforcement and DOES NOT end up in FBI or local crime statistics. If you want details, see below. If not, skip this section.
Does this mean that FBI statistics are invalid? No. While the great majority of crimes go unreported, their trend lines are historically instructive regardless of the numbers recorded. There is a current disagreement with the trend lines (decreases) relative to the National Crime Victimization Survey (increases in rates of violent crime).
Crime underreporting means that crimes reported to the police (as offered by the FBI and others) provide a subset of crime, which is why the US Department of Justice created the National Crime Victimization Survey over 50 years ago to measure all crime (except business crimes and homicides—you can’t interview dead people). People younger than age 12 are not included in the NCVS.
For example, approximately 70 to 80 percent of all crimes are property offenses, and, according to the USDOJ’s Bureau of Justice Statistics, only 30 percent of those are brought to the attention of the police.
The FBI offers reported crime, not all crime, yet the great majority of media and public crime discussions will solely focus on FBI data, which poses ethical and journalistic challenges.
The criminological community has traditionally supported the National Crime Victimization Survey as a far more accurate overview of crime in the United States.
Estimated crimes reported to law enforcement via the FBI in 2025 include:
| Violent crime | 1,119,768 |
| Property crime | 5,245,768 |
| Total violent + property crime | 6,365,536 |
The FBI received crime data from 17,075 law-enforcement agencies in 2025, covering 96.2% of the U.S. population. Based on those submissions, the FBI estimated 6.37 million violent and property crime offenses nationwide.
The FBI reports that 15,099 agencies (77.2%) submitted National Incident-Based Reporting System (NIBRS) data in 2025. Unlike the old Summary Reporting System, NIBRS (explained below) can record up to 10 offenses within a single incident. The 6.37 million figure is essentially the traditional Summary Reporting System-style national measure, which only counts the most serious crime.
Most reported crimes (or criminal charges) are NOT included in total FBI crime reports. They are, however, included in topical reports.
FBI crime numbers (6.37 million) are compared to the 40 million-plus figure via the National Crime Victimization Survey (includes fraud and identity theft).
Reported Crimes In 2020–2023 By Location: About 38% of violent victimizations in urban areas were reported to police, which was lower than the percentages in suburban (43%) and rural (51%) areas. The reason for considering this data is that urban areas drive most reported crimes in a state.
Percentages Of Reported Crime From Official Yearly Reports From The National Crime Victimization Survey:
46 percent of violent victimizations were reported to police in 2021, higher than in 2020 (40%), per the Bureau of Justice Statistics.
42 percent of violent victimizations were reported in 2022. 32 percent of property crimes were reported.
45 percent of violent crimes were reported in 2023. 30 percent of property crimes were reported.
47.9 percent of violent victimizations were reported in 2024. 30 percent of property crimes were reported.
74 percent of violent victimizations against juveniles were not reported to the police, and juvenile crime seems to be growing in some cities.
For identity theft, roughly 7 percent of incidents were reported, according to the Bureau of Justice Statistics.
There are 120 million porch package thefts in 2024, far more than all categories of property crime recorded by the FBI. Twenty-three percent of porch package thefts are reported to law enforcement.
About 12,000 yearly hate crime incidents were reported to the FBI, and approximately 250,000 yearly hate crime incidents were recorded by the Bureau of Justice Statistics National Crime Victimization Survey in 2023.
As with all crime statistics, caution is urged; some variables affect people’s willingness to report crimes.
Variables include: Most violent crimes involve offenders whom victims know, and it may be considered a private or personal matter. There may be little chance of finding the offender for property crimes, so victims are reluctant to report. Additional considerations include: excessive wait times for police officers to arrive; police resignations or retirements; issues with police-community relations due to protests regarding use of force and negative media coverage of use of force issues; police officers not writing reports because they believe that criminal justice reforms negate their efforts or they are discouraged from creating reports by their agencies due to pressure to reduce crime numbers.
Is Law Enforcement Reporting All Crimes Per Incident To The FBI?
Law enforcement agencies have dramatically improved their adoption of the FBI’s new National Incident-Based Reporting System (NIBRS). The FBI, however, is allowing some agencies to submit data based on a single primary crime. See below for a longer explanation of the NIBRS.
NIBRS collects data for 52 offenses, plus 10 additional offenses for which only arrests are reported. The FBI’s older collection policy, the Summary Reporting System (SRS), counts limited data for 10 offenses and 20 additional crimes for which only arrests are reported.
NIBRS adoption by law enforcement was a struggle for years because, instead of police agencies traditionally reporting one primary crime per incident, they could report up to 10 crimes connected to a single incident to the FBI. Many police agencies feared a public relations fallout. There were other reasons for not adopting the NIBRS, ranging from funding to technical capabilities.
Multiple charges are routine after an arrest; they are used for plea bargaining, the primary method of disposing of 90 percent of criminal cases. Some observers suggest that there are far more crimes occurring than are reported to the FBI because some law enforcement agencies continue to report one primary crime to the FBI rather than all crimes related to an incident. See a story from CBS News as an example.
Regardless, when the FBI releases crime data, it only offers primary crimes via the older Summary Reporting System to keep pace with past years.
Multiple crimes per incident (up to 10) are, however, included in topical reports offered on the FBI’s website.
Note that arrests have plummeted over the last two decades, and arrests declined sharply since the beginning of the police use of force protests and COVID; thus, there is evidence that events affect numbers.
Some large police departments state that they are hundreds of officers below authorized positions, and it can take over an hour for a police officer to respond to a lower-priority victim. Some crime victims are not willing to wait. If there’s no arrest and no paperwork, was the crime counted in official statistics?
Crimes solved have also declined considerably.
Use Of Big City Police Crime Dashboard Data-Are City Crime Numbers An Accurate Indication Of National Crime?
Why do I include crime reports based on big-city police crime dashboards? Three groups and national news organizations now use the method, and they are driving the current conversation of whether crime is increasing or decreasing in the United States cities based on reported crimes.
People are tired of waiting for the FBI to release crime data for the previous year in late summer or fall. But, interestingly, the FBI is now releasing monthly, quarterly, and half-year national reported crime data per their announcement of 2024 yearly crime statistics in August 2025. Updated crime statistics are on the FBI’s main page for crime data.
Numbers for 2024-2026, per big city crime dashboards, have their own section below. Warning. One private organization’s predictions were mostly inaccurate. They are not alone; preliminary crime reports from the FBI can significantly overstate the percentage of crime decrease offered at the end of the year.
Reported Crime Decreases Were Inevitable After Big Increases
Decreases in reported crime could also be nothing more than an ebb and flow of crime numbers over time. After the Major Cities Chiefs Association report stated that homicides increased by 50 percent and aggravated assaults increased by 36 percent for their cities measured from 2019 to 2022, it was inevitable that reported violence would decrease regardless of interventions (known as a regression to the mean or average). Increases or decreases in crime always change over time, regardless of crime interventions. Many believe that mayors and others taking credit for reported crime drops are overstating their case.
Baseline Data
You can prove any crime statistic you want based on the year you compare statistics to (baseline data). Most current use of baseline data compares crime to 2019, the year before COVID. If a source uses earlier data, be wary of the result.
Full-Year Crime Reports Versus Preliminary Crime Reports
You will see discussions of full-year crime reports versus preliminary crime reports. Traditionally, full-year final crime reports are considered the official position of the US Department of Justice through the FBI and the National Crime Victimization Survey.
Preliminary reports “may” be accurate but are subject to change; they often overstate crime trends (see below). Preliminary reports need to be used with caution (the data could [and often does] dramatically change).
Preliminary crime statistics only apply to FBI data. The National Crime Victimization Survey does not issue preliminary numbers.
The FBI and the National Crime Victimization Survey Revises Its Crime Numbers
See Jeff Asher’s analysis regarding revisions in numbers from the FBI for 2021. Jeff states, “The problem is that the NIBRS switch meant that the share of the US population covered by an agency reporting crime data fell from roughly 95 percent in an average year to 65 percent in 2021.” “The 2021 estimates require an asterisk and should be ignored, and those analyzing crime trends shouldn’t rely on them.”
If you want to explain how the FBI and the Bureau of Justice Statistics revise or compute missing or incomplete data from law enforcement agencies, see here via Jeff Asher.
Both the FBI and the Bureau of Justice Statistics released data before the presidential election in 2020, indicating that violence decreased. Both clarified via email that there were definitional issues and that violence did not decrease.
The FBI’s preliminary numbers for 2023 and 2024 were significantly off when compared to the final numbers (see below). There seems to be more agreement with the 2025 FBI preliminary and final crime statistics.
The moral of the story? There are disagreements and changes as to crime numbers. I suggest that you not wed yourself to precise crime data as offered; numbers can change. Compare multiple sources. Use official final yearly reports.
Crime Reports Vary By Methods Of Data Collection
Readers ask about the differences between crimes reported to law enforcement through the FBI and crimes collected via the National Crime Victimization Survey from the Bureau of Justice Statistics.
This report uses data from various sources that collect crime numbers in different ways and offer their findings in divergent formats. Reports may differ based on the methodologies used and how they report their findings. Disagreements as to findings may be nothing more than how the data was collected and presented.
Divergent reports collect and report crime data differently; it’s not necessarily a matter of correct or incorrect data.
Long-Range Crime Data
The United States experienced a substantial drop in criminality over a 20-year-plus period (covered below), which partially ended with a 28 percent increase in violent crime and serious violent crime (2018 compared to 2015) per the National Crime Victimization Survey. It’s up to readers to judge if long-range crime charts are meaningful or a history lesson. Most readers don’t care what happened in 1995; they want to know what’s happening now (or in recent years) as to crime and their safety.
The National Crime Victimization Survey Likes Stability In Its Narratives
The National Crime Victimization Survey will suggest stability in crime statistics in its narratives over the course of two or more years, even if there are small decreases or increases. For 2024 property crimes, their narrative suggests a lack of change (using the word comparable), but their numbers and rates from 2023 to 2024 decreased by small amounts. Check the chart footnotes for possible reasons.
Complexity Of Understanding National Crime Statistics
Yes, it’s confusing. Sometimes massively so. Even those of us who spend a lifetime examining national crime statistics become bewildered by the complexity of crime and its accurate reporting.
Most federal crime reports and websites are intricate and difficult to read and understand, which is the reason for creating this report.
Links
I do not source every link. Links per year are offered above and below for the FBI and the National Crime Victimization Survey.
4.
Property Crimes
While most of this report focuses on violent crime, it’s important to note that there “was” a considerable and continuous decrease in property crime over time (with some exceptions from the FBI and the National Crime Victimization Survey) until the National Crime Victimization Survey for 2022 released data saying that:
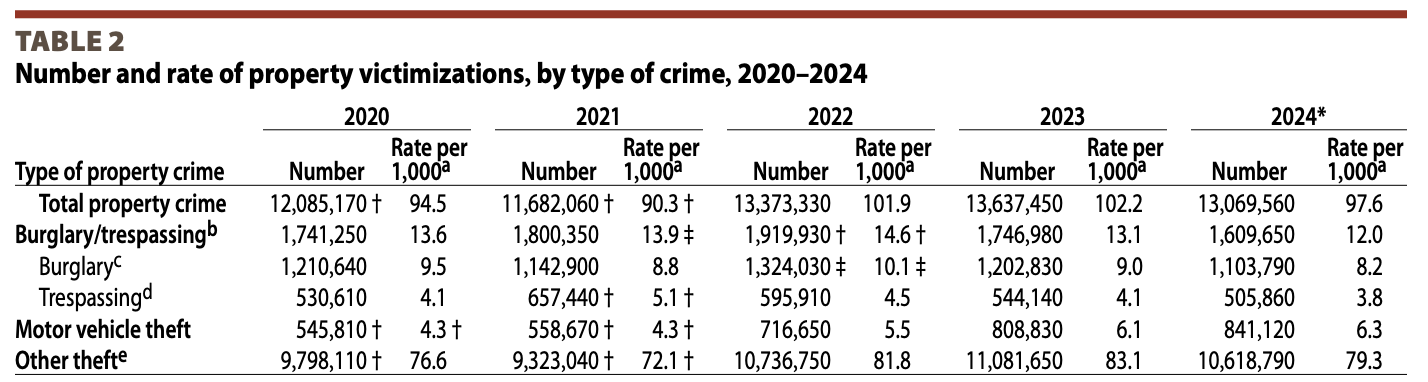
Households in the United States experienced 13.4 million property victimizations in 2022, up from 11.7 million in 2021. The rate of property victimization in 2022 was 101.9 victimizations per 1,000 households, higher than the rate in 2021 (90.3 per 1,000).
The number of property victimizations in 2023 was similar to the number in 2022. Households in the United States experienced 13.6 million property victimizations in 2023. The number of property victimizations was comparable to the number in 2022 but higher than the 12.8 million in 2019.
Per the National Crime Victimization Survey for 2024, households in the United States experienced 13.1 million property victimizations in 2024, which was comparable to the number in 2023 but larger than the number 5 years before, in 2020 (12.1 million). Property crime includes burglary or trespassing, motor vehicle theft, and other types of household theft.
The rate of property victimization remained stable from 2023 to 2024 (97.6 victimizations per 1,000 households) and was also similar to the rate in 2022. There were no significant changes in the rates of specific types of property victimization between 2023 and 2024. The motor vehicle theft rate increased from 4.3 per 1,000 in 2020 to 6.3 per 1,000 in 2024.
Chart-National Crime Victimization Survey-2024
FBI Property Crimes Reported To Law Enforcement
According to crimes reported to law enforcement, as recorded by the FBI, the property crime rate increased considerably for the first time since 2012, according to the FBI’s 2022 report.
For 2023, the FBI suggests declines in all forms of property crimes except for vehicle theft (which increased considerably). It’s –2.4 percent overall, for burglary, -7.6 percent, for Larceny, -4.4 percent, for motor vehicle theft, it increased by 12.6%.
The 2024 FBI report shows an overall decrease in property crime of 8.1 percent, burglary-8.6%, larceny-5.5%, and motor vehicle theft-18.6%.
In 2025, the FBI reports continued decreases in property crime by 12.4 percent. Decreases include 16.8 percent for burglary, 9.8 percent for larceny, and 22.7 percent for vehicle theft.
Other Sources For Property Crimes
It should be noted that much of the data below uses vastly different methodologies than reported crimes via the FBI and numbers offered by the National Crime Victimization Survey. The years cited may not include 2025 or 2026 findings.
The Street: “Amazon and Walmart hit by $12.8 billion theft surge.” Package theft, or porch piracy, as it’s known, has become a growing problem, according to the latest report issued by Omnisend. “Combining its original research with FBI crime data, the report found that Americans have suffered a loss of roughly $12.8 billion as a result of about 228 million stolen parcels last year alone,” the study showed. Porch piracy is effectively becoming a hidden cost center of e-commerce logistics.
Per Slate and The National Retail Federation, the NRF announced that for the first time in more than three decades, it wouldn’t publish its annual shrink report. Instead, the group decided on a new approach, “The Impact of Retail Theft & Violence 2024,” Instead of getting data from retailers themselves, the report went to senior loss prevention and security executives. This was where the group got the startling information that there had been a 93 percent increase in the average number of shoplifting incidents per year in 2023 compared to before the pandemic, and a 90 percent increase in dollar loss.
Per Gallup, Americans are most likely to have experienced theft, with 14% saying money or property was stolen from them or another household member in the past year. Vandalism, at 12%, is also one of the more common crimes. The biggest increase observed in 2021 was three percentage points for burglary, with 5% saying their home or apartment was broken into in the past year.
Per Gallup, identity theft and scams are almost two to three times the number of total crimes reported by the FBI. One could make the case based on the National Crime Victimization Survey and Gallup that crime is not receding in the US; it’s just taking on different forms of victimization. Scams cost U.S. adults an estimated $68 billion, more than four times what was reported to federal authorities in 2025. Gallup continues to find very high levels of concern about violent crime. But fear of identity theft is very high. Nearly three-quarters of individuals who say they or their household experienced a scam in 2025 say it had a negative impact on their mental health or well-being. Virtually all adults (98%) believe scams pose a threat to individuals in the U.S. When we address the impacts of crime in America, we seem to ignore skyrocketing identity theft, fraud, and scams.
Overall, adults 60 and older reported losing $2.4 billion in 2024 to fraud, including money lost to investment scams, according to the FTC’s annual report to Congress released Dec. 1. That’s up 26.3% from $1.9 billion in 2023.
Retail shrinkage (shoplifting, organized attacks, and employee theft) hit $94.5 billion in 2021, a 53% jump from 2019, according to the National Retail Federation’s annual survey of around 60 retail member companies, CNN. Data from a variety of sources suggest that shoplifting losses continue to increase.
There are 120 million porch package thefts in the US. Searches for “stolen package” spike every December, according to Google Trends. The survey indicated that there are far more porch pirate thefts than total reported property crimes to the FBI. The financial toll of these thefts is $16 billion.
Inside Edition Television offered a report examining storage unit thefts. They observed that storage unit companies often did not report break-ins to law enforcement and cited a storage company in Denver that had 55 burglaries in one year.
Governing: A new report from the FBI Internet Crime Complaint Center shows cybercrime losses in the United States reached $20.9 billion in 2025, continuing a years-long surge in both financial damage and the number of reported incidents, Governing reports. More than 1 million cyber-enabled crimes were reported last year, up sharply from previous years, with investment fraud — particularly cryptocurrency scams — accounting for the largest share of losses. Federal officials say many of these schemes begin through social media, dating apps or text messages, where scammers build trust before steering victims toward fake investment platforms designed to steal funds. The sheer number of cyber-related crimes reported each year has risen rapidly, from about 288,000 in the mid-2010s to 791,000 at the end of that decade. And the trend continues, with 2025 seeing more than 1 million reported crimes. Unsurprisingly, the most populous states — California, Texas, Florida and New York — reported the most cyber-enabled crimes and the greatest financial losses to such crime. But when drilling down to complaints per 100,000 citizens, Washington, D.C., Alaska, Nevada, and Arizona topped the list.
The Hill (newspaper of Congress) addresses cargo theft. The numbers we do know are concerning. The average value of each cargo theft is more than $200,000, and according to the National Insurance Crime Bureau, there has been a 1,500 percent increase in cargo theft incidents since 2021. Total cargo theft losses increased by 27 percent in 2024 and are projected to rise another 22 percent in 2025.
Check fraud. “This is far from an isolated incident. A recent report from the FBI and United States Postal Inspection Service (USPIS) shows cases of check fraud nearly doubled between 2021 and 2023 nationwide.”
Mail Theft. “Letter carrier robberies surged by 845 percent nationwide between fiscal 2019 and 2023, from 64 robberies per year to more than 600. High-volume mail theft has skyrocketed 2,500 percent since 2010, with more than 52,000 reported cases in fiscal 2024, according to federal data obtained by the Postal Police Officers Association.” Washington Post.
Pew: Most U.S. adults (73%) say they’ve experienced some kind of online scam or attack across age groups. Many get scam calls, texts, and emails at least weekly.
Apartment Fraud: A survey of about 70 apartment operators conducted at the end of 2023 by the National Multifamily Housing Council, a trade group, found that 70% had seen an increase in fraudulent applications and payments over the preceding 12 months. A separate study last year by RealPage reported a similar rise — of roughly 400 property managers surveyed across five large metros, 75% reported an increase in fraudulent behavior.”
So the FBI may be recording decreases in property crimes in 2024 and 2025, but the National Crime Victimization Survey offers stability as to rates and numbers over time (with my reading of the above chart indicating small decreases in rates and numbers for 2024).
The data from the agencies above includes various dates, suggesting increases. Those increases are obviously not making it into FBI property crime statistics.
5.
Summation of Violent and Property Crime Data from the FBI, 2021-2026
Summation of Violent and Property Crime Data From the National Crime Victimization Survey, 2022- 2024 (latest yearly official data)
See Brief and Extended Summations Of Historical Data From The FBI and Bureau of Justice Statistics—National Crime Victimization Survey, 2012 to 2026, On Pages 13-14
FBI Releases Official 2025 Crimes Reported To Law Enforcement
More than 17,000 state, county, city, tribal, and university and college agencies, covering a combined population of 96.2% of inhabitants, submitted data to the UCR Program through the National Incident-Based Reporting System (NIBRS) and the Summary Reporting System. Nearly 17,000 (16,791) agencies participated in the Hate Crime Data Collection, with a population coverage of 95.3%.
There are approximately 18,000-20,000 police agencies “but” most sources state that there are 18,000. The FBI’s UCR program currently describes its universe as more than 19,000 federal, state, county, tribal, university/college, and other law-enforcement agencies. BJS says it mailed its 2018 census to nearly 20,000 potentially operating agencies. Some were subsequently excluded because they were duplicates, closed, private, lacked general arrest powers, used only part-time officers, etc.
Sidebar—Increasing Crime In Cities
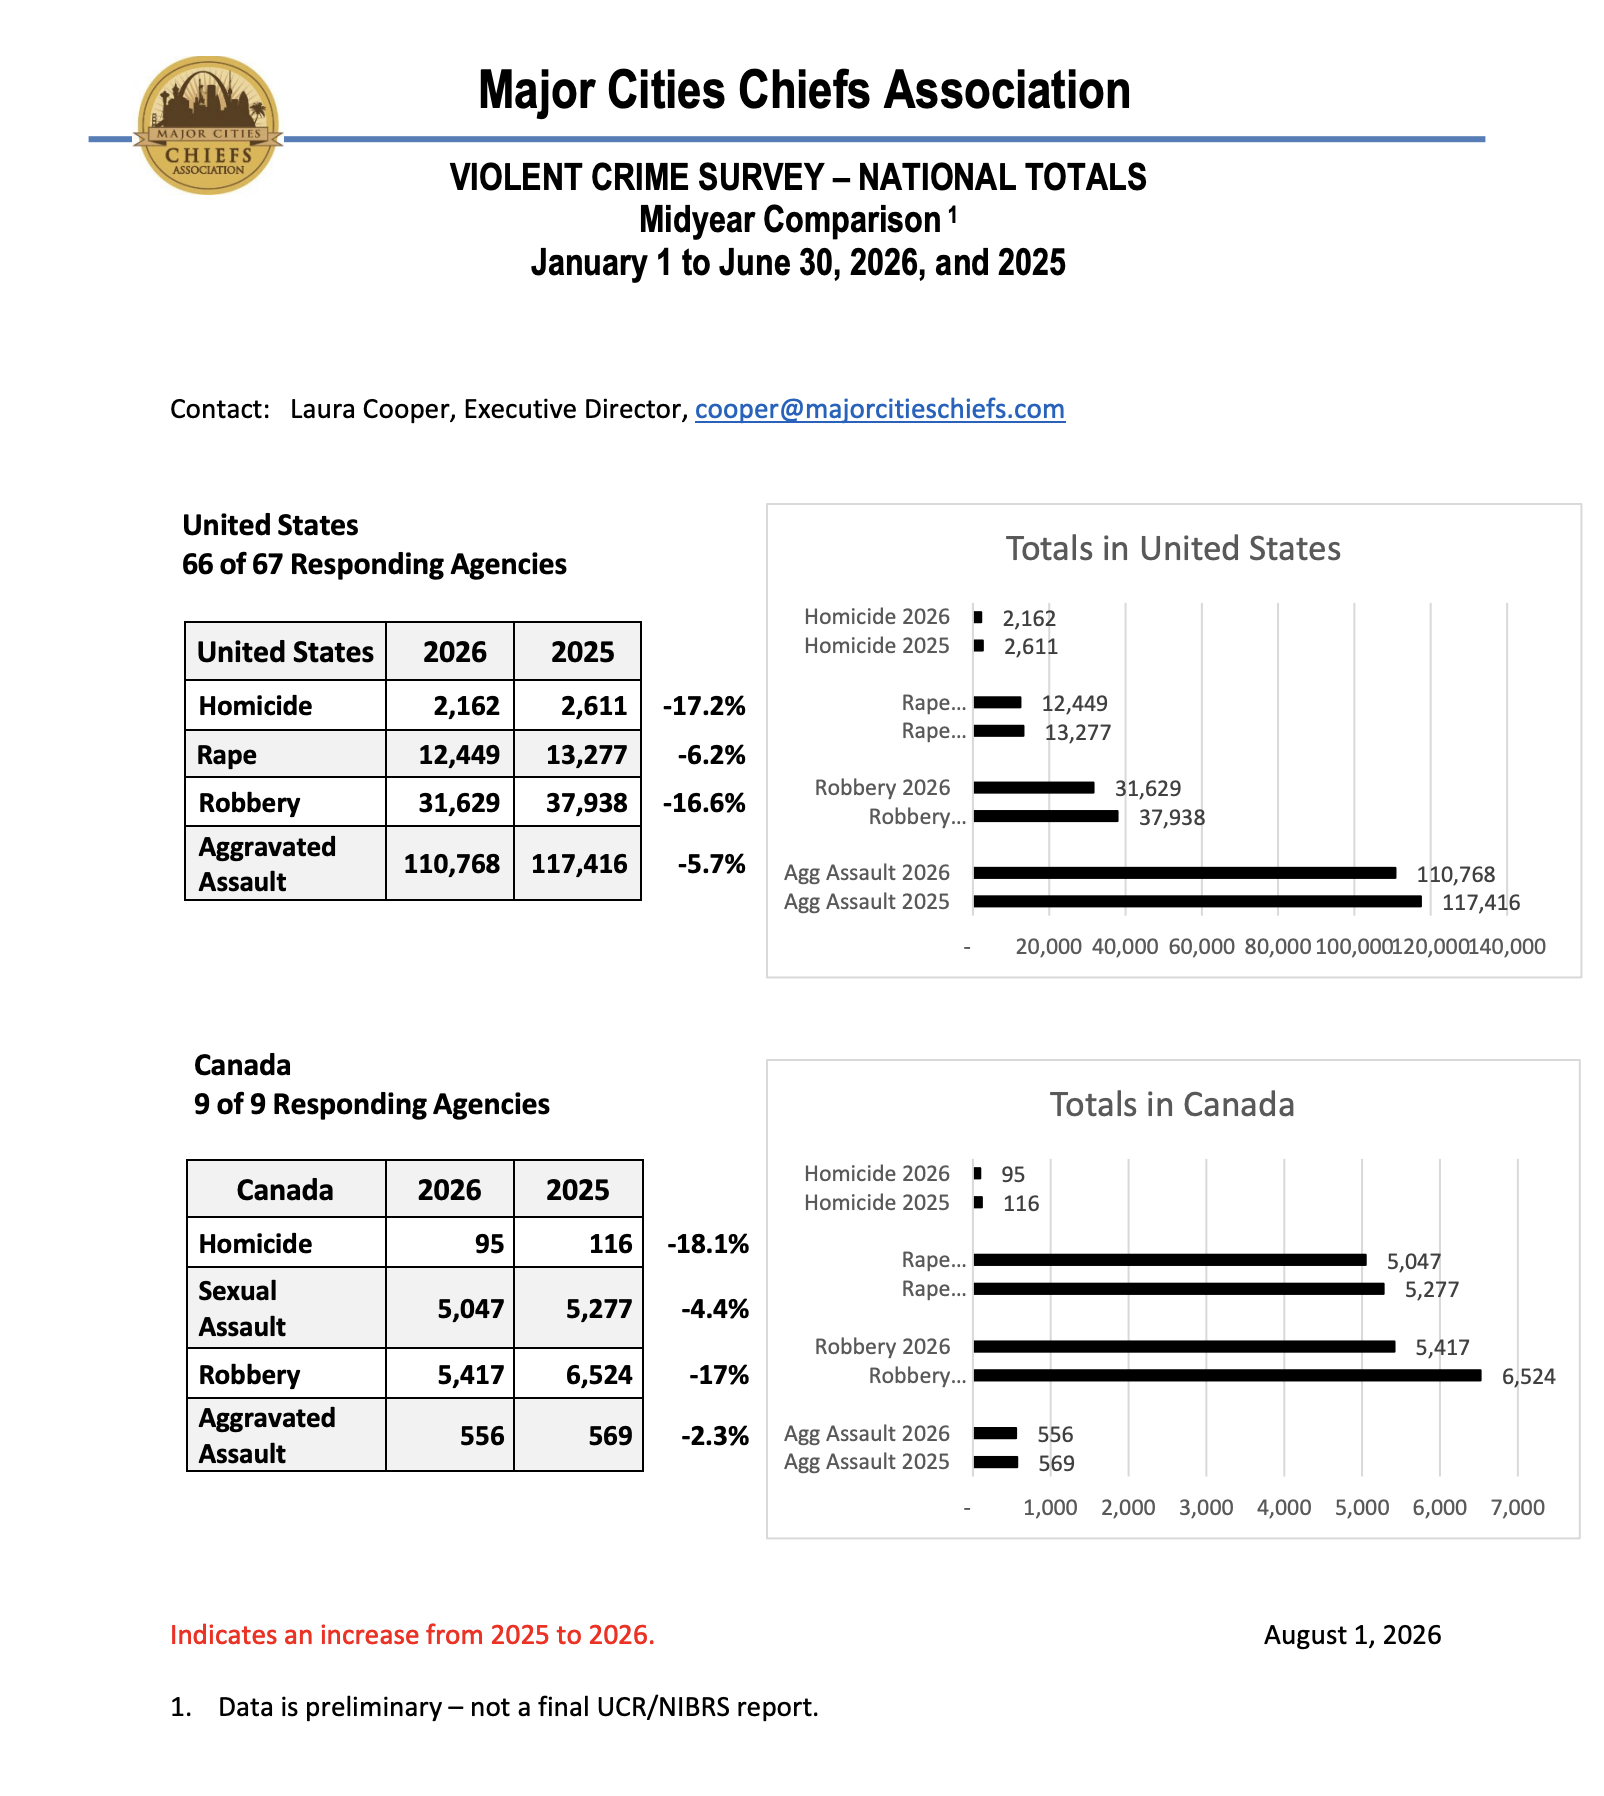
Per the Major Cities Chiefs Association, a category (or multiple categories) of violent crime increased for 35 of the 66 US cities surveyed. Seven out of 9 Canadian cities had an increase in at least one category of violent crime. Increases in aggravated assaults (the most common violent crime) were apparent. Sixteen US and 3 Canadian cities had increases in homicides.
Sidebar–Domestic Violence Homicides
An interesting but tragic side note: FBI counts of homicides are decreasing. Per CBS News, almost 5.4 million Americans have reported being victims of domestic violence over the last five years. The majority, nearly 80%, were women. And according to the FBI, domestic homicides more than doubled between 2019 and 2024, increasing from 1,065 to 2,339. The latest data has experts worried. Across the US, the share of violent crimes that involve domestic violence has increased from 25% in 2020 to 27.5% in 2024, according to a 2026 FBI report.
Nearly two-thirds of women have experienced abuse from a spouse or romantic partner, known as intimate partner violence or domestic violence. Sixty-eight percent reported experiences of sexual violence, including verbal or online harassment, forced sex or physically aggressive sexual harassment, according to the research report from Tulane University and the University of California, San Diego.
Sidebar–Gun Homicide Rate
Per the Guardian, “Fatal shootings have fallen to historic lows across the US, but teenagers have not shared equally in that progress. According to an analysis by the Trace and the Guardian of the most recent data from the Centers for Disease Control and Prevention (CDC), the gun homicide rate among 15-to-19-year-olds has declined from its peak in 2022, but it’s still roughly the same or higher today than it was before COVID.”
Sidebar-Retail Workers Facing Aggression
Per The Street, A new report from HALOS, a bodycam company used by Walmart, Target, Kroger, TJ Maxx, H&M, and Aldi, shows potential violence towards employees, and that the impact is quite severe. Two-thirds of frontline workers have experienced customer aggression acutely enough that they’ve considered leaving their job, according to HALOS’ study of 2,500 frontline employees. Nearly 40% say customer aggression has increased over the past 12 months. In addition, the study found that 57% of frontline workers experienced customer abuse or know a colleague who had during a typical four-week period.
Sidebar-Juvenile Crime
To explain its need for more youth prisons, Tennessee’s DCS points to a recent state-commissioned study. It shows that police reports of violent juvenile crimes in Tennessee — including murder, aggravated assault, motor vehicle theft and crimes with firearms — have increased since 2013.
FBI Reported 20-Year Violent and Property Crime Trends, 2006-2025
Estimated rates of murder and nonnegligent manslaughter reached a 20-year high of 6.6 offenses per 100,000 inhabitants in 2020 and 2022. The 2025 estimated murder rate of 4.1 offenses per 100,000 inhabitants is the lowest recorded in the past 20 years.
The 20-year trends show estimated rape rates were below 30.0 offenses per 100,000 inhabitants from 2006 through 2012. Estimated rape rates began rising in 2013, surpassing 40.0 offenses per 100,000 inhabitants from 2016 through 2023. The 36.1 estimated rape offenses per 100,000 inhabitants in 2025 is the lowest rate since 2012.
The 2025 robbery rate is the lowest estimated rate (49.4 offenses per 100,000) in 20 years. This is less than one-third of the rate at its 20-year high (150.1 offenses per 100,000) in 2006.
Estimated aggravated assault rates decreased each year from 2006 to 2011. While lower than recent years, the estimated 238.0 aggravated assault offenses per 100,000 inhabitants in 2025 is higher than each year’s estimated rate from 2013 through 2015.
20-year trends in estimated property crime rates per 100,000 inhabitants from 2006 to 2025.
Estimated burglary offense rates have decreased every year from 2011 to 2021.
Estimated larceny-theft rates have decreased every year except from 2021 to 2022. Both estimated burglary and larceny-theft rates recorded 20-year lows in 2025, with burglary below 200.0 offenses per 100,000 and larceny below 1,200.0 offenses per 100,000.
In 2025, the estimated motor vehicle theft rate was the lowest in the last 20 years, with a 23.0% decrease compared to the previous year. This is a 38.8% decrease from 2023, which had the highest rate since 2007.
Summary of the Most Recent Violent Crime Data from the FBI, Violent Crime May 2025 to April 2026
Note that this will change based on updated numbers from the FBI. See the link for updates.
Violent crime decreased by an estimated 9.3%.
Murder and nonnegligent manslaughter decreased by an estimated 19.1%.
Rape decreased by an estimated 9.1%.
Robbery decreased by an estimated 19.1%.
Aggravated assault decreased by an estimated 6.9%.
Summary of the Most Recent Property Crime Data from the FBI, Property Crime 2025 May 2025 to April 2026
Note that this will change based on updated numbers from the FBI. See the link for updates.
Property crime decreased by an estimated 12.3 %.
Burglary decreased by an estimated 16.5%.
Larceny-theft decreased by an estimated 9.8%.
Motor vehicle theft decreased by an estimated 21.6%.
Summary of Violent Crime Data from the FBI, 2025
Violent crime decreased by an estimated 9.3%
Homicides decreased by an estimated 18.1%
Rape decreased by an estimated 7.6%
Robbery decreased by an estimated 18.5%
Aggravated Assaults decreased by an estimated 7.2%
Summary of Property Crime Data from the FBI, 2025
Property crime decreased by an estimated 12.4%
Burglary decreased by an estimated 15.8%
Larceny decreased by an estimated 9.8%
Motor Vehicle Thefts decreased by an estimated 22.7%
Summary of Violent Crime Data from the FBI, 2024
Violent crime decreased by an estimated 4.5%
Homicides decreased by an estimated 14.9%
Rape decreased by an estimated 5.2%
Robbery decreased by an estimated 8.9%
Aggravated Assaults decreased by an estimated 3.0%
Summary of Property Crime Data from the FBI, 2024
Property crime decreased by an estimated 8.1%
Burglary decreased by an estimated 8.6%
Larceny decreased by an estimated 5.5%
Motor Vehicle Thefts decreased by an estimated 18.6%
Warnings On The Use Of Preliminary Reported Crime Data
If one examines the preliminary reports from the FBI for 2024, significant differences are apparent between the mid-year projections and the actual outcomes in 2024. The FBI projected a 10.3 percent reduction in violent crime.
The end-of-year FBI report recorded a 4.5 percent reduction in violence. There are very big differences in the FBI’s preliminary report and end-of-year analysis for murders, rapes, robberies, aggravated assaults, and property crime; all were considerably off their projections. Mid-year reports may be inaccurate because a substantial number of police agencies report their crime figures at the end of the year.
If one looks at FBI figures for the month when most crime happens, it’s December. Is that accurate? No. It simply reflects the fact that some (many?) police agencies can (and do) wait till the end of the year to offer crime statistics. What you get now will change. More on this topic is below.
Summary of Violent Crime Data from the FBI, 2023
Violent crime decreased by an estimated 3.0%
Murder decreased by an estimated 11.6%
Rape decreased by an estimated 9.4%
Aggravated assault decreased by an estimated 2.8%
Robbery decreased by an estimated 0.3%
Summary of Property Crime Data from the FBI, 2023
Overall property crime decreased by an estimated 2.4%
Burglary decreased by an estimated 7.6%
Larceny decreased by an estimated 4.4%
Motor Vehicle Theft increased by 12.6%
A Summation For Preliminary Full-Year 2023 Data From The FBI
The FBI, in March of 2023, released a preliminary full-year crime report for 2023 in record time. Throughout decades of FBI crime data, the release of full-year data has never happened this early. Ordinarily, we would have to wait until late summer or fall for an official full-year crime report. There was a presidential election in 2024.
It’s Overstated
It indicates that every category of crime was overstated in the preliminary report; the predicted decreases were greater than those in the official full-year report. For example, the preliminary report predicted a 5.7 percent reduction in violent crime. The official report for 2023 puts the decrease at 3 percent.
The preliminary report offers a 13.2 percent reduction in homicides, whereas the official report offers a decrease of 11.6 percent.
The preliminary report indicated a decrease of 4.7 percent in robberies. The official report offers a 0.3 percent decrease.
The lesson? Preliminary reports from the FBI (or private organizations) can overstate crime reductions or increases.
The preliminary report also indicated that reductions in crime were much higher for nonmetropolitan areas than for metropolitan areas, which was surprising.
Summary of Violent Crime Data from the FBI, 2022
The FBI offers 12 categories of crimes (13, including hate crimes). Four categories decreased, six categories increased, and one (burglary) was flat. Hate crimes increased.
Violent crime decreased by an estimated 1.7%
Murder decreased by an estimated 6.1%
Rape decreased by an estimated 5.4%
Aggravated assault decreased by an estimated 1.1%
Robbery increased by an estimated 1.3%
Summary of Property Crime Data from the FBI, 2022
The property crime rate increased considerably for the first time since 2012.
Property crime increased by an estimated 7.1%
Burglaries decreased by an estimated 1.7%
Larcenies increased by an estimated 7.4%
Motor Vehicle Theft increased by an estimated 10.5%Summary off Violent Crime Data from the FBI, 2021
Violent crime decreased by an estimated 1.0%
Murder increased by an estimated 4.3%
Rape increased by an estimated 3.4%
Robbery decreased by an estimated 8.2%
Aggravated Assault decreased by an estimated 0.1%
Summary of Property Crime Data from the FBI, 2021
Property crime decreased by an estimated 3.8%
Burglary decreased by an estimated 11.4%
Larceny decreased by an estimated 4.9%
Motor vehicle theft increased by an estimated 13.3%
Summation Of National Yearly Violent Crime Data-2021 From Multiple Sources
For 2021, the FBI used a special NIBRS-based estimation method because 2021 was the first year in which NIBRS became the national reporting standard. The FBI compared its NIBRS estimates for 2021 with comparable NIBRS estimates for 2020. The FBI emphasized that the estimates had relatively wide uncertainty and that the observed changes were not statistically significant.
To suggest that the numbers for 2021 are massively complex (based on their methodologies and problems collecting data, especially from urban police agencies) would be an understatement. There are analysts suggesting that the 2021 FBI crime data be used with extreme caution.
You could legitimately state that violent crime did not increase in 2021 based on numbers from the FBI and the National Crime Victimization Survey.
But it’s equally correct to state that, per the FBI, homicides increased considerably between 2019 and 2021 (nearly 30 percent in 2020 and 4.3 percent in 2021) and that murders have been traditionally used by criminologists as an indicator of all violent crime. Rapes also increased in 2021.
The 2021 US firearm homicides (81 percent of all murders) were the highest since the 1990s, Centers For Disease Control (CDC) data show. They recorded an 8.3 percent increase in 2021, CNN.
The risk of victimization while a person was out in public rose by nearly 40% by April 2020, according to the National Academies Of Sciences.
From 2020 to 2021, the violent victimization rate increased from 19.0 to 24.5 victimizations per 1,000 persons in urban areas, while remaining unchanged in suburban or rural areas, per the Bureau of Justice Statistics National Crime Victimization Survey.
The rate of serious (excluding common assaults) violent victimization in urban areas also increased, per the Bureau of Justice Statistics National Crime Victimization Survey.
Per Gallup, there is a big increase in the criminal victimization of urban households in 2021, 30 percent compared to 22 percent in 2020. Seven percent of urban residents were violently victimized compared to 3% of U.S. adults. The collective data (urban crime victimization-computer crime) indicates a growing crime problem for at least half of American households (link below).
Yet it’s the official position of the US Department of Justice via the FBI and the National Crime Victimization Survey that overall violent crime was flat for 2021.
Sources for the above are available at New US Crime Data.
Waiting For the 2025 Yearly Update from The National Crime Victimization Survey
Summation Of The Most Recent Violent And Property Crime Data From The National Crime Victimization Survey-2022-2024 (latest yearly official data)
National Crime Victimization Survey Releases 2022 Crime Statistics—Largest Increase in Violent Crime In The Nation’s History
I’m going to start the discussion of the National Crime Victimization Survey with its report from 2022 because of a record increase in violent crime rates, and how rates for NCVS data for 2023 and 2024 remain largely consistent with 2022.
We seem to be at a new high for violent crime rates in the United States, which contradicts data from cities and numbers offered by the FBI.
The National Crime Victimization Survey, in a report for the calendar year 2022, offered the largest increase in violent crime in the nation’s history (44 percent), according to analyst Jeff Asher, and The Marshall Project. Interestingly, ChatGPT puts the increase at 42 percent.
The Bureau of Justice Statistics did not provide the percentage increase (but they have provided percentage increases multiple times in the past, i.e., a 28 percent increase in violent crime, 2015-2018.
Report (August 2023) from the National Crime Victimization Survey for 2022
As stated above, violent crime increased by 44 percent in 2022 according to the National Crime Victimization Survey, per Jeff Asher and The Marshall Project.
A 44 percent increase in violence is the largest ever recorded.
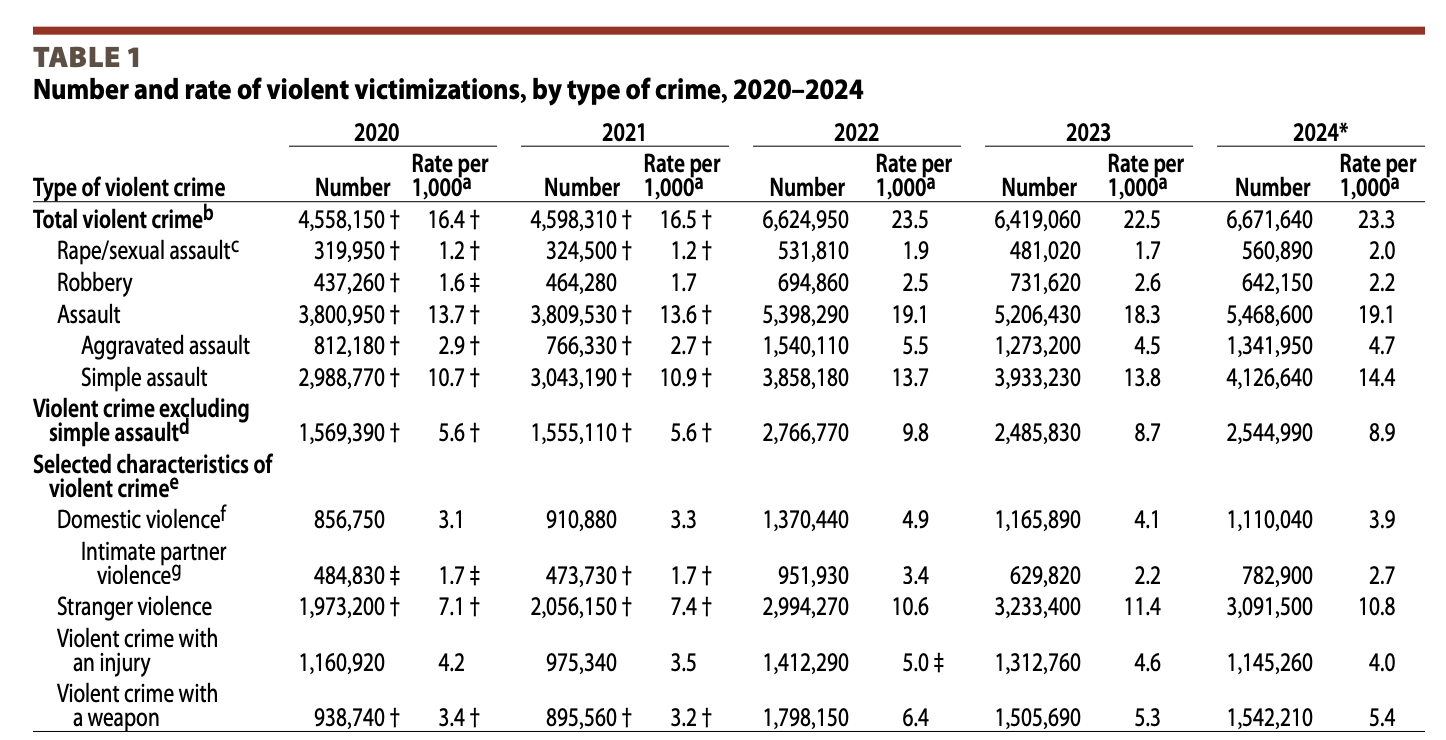
The violent victimization rate increased from 16.5 victimizations per 1,000 persons in 2021 to 23.5 per 1,000 in 2022.
There were 6.6 million violent victimizations of persons age 12 or older in the United States in 2022, up from 4.6 million in 2021.
Many groups had large percentage increases in violent victimization.
Households in the United States experienced 13.4 million property victimizations in 2022, up from 11.7 million in 2021.
The rate of property victimization in 2022 was 101.9 victimizations per 1,000 households, higher than the rate in 2021 (90.3 per 1,000).
In 2022, about 2 in 5 (42%) violent victimizations were reported to police.
Motor vehicle theft victimization increased from a rate of 4.3 victimizations per 1,000 households in 2021 to 5.5 per 1,000 in 2022.
About 10% of violent victimizations involved a firearm in 2022, an increase from 2021 (7%).
In 2022, about 1.24% (3.5 million) of persons age 12 or older nationwide experienced at least one violent crime.
Report From the National Crime Victimization Survey for 2023
Per the press release (September 12, 2024) from the US Department of Justice for the new 2023 report, “Data from the National Crime Victimization Survey (NCVS) indicate that in 2023, the rate of nonfatal violent victimization in the United States was 22.5 victimizations per 1,000 persons age 12 or older, which was similar to the 2022 rate of 23.5 violent victimizations per 1,000 persons age 12 or older.”
Per the September 12, 2024, USDOJ press release headline, “Violent victimization unchanged year over year…”
That means that the record violent crime rates in US violence largely continued from 2022 to 2023 to 2024.
In 2023, there were 22.5 violent victimizations per 1,000 persons age 12 or older in the United States.
About 9% of violent victimizations involved a firearm in 2023, similar to 2022.
The rate of property victimization in urban areas (emphasis added) increased from 176.1 per 1,000 households in 2022 to 192.3 per 1,000 in 2023.
The rates and numbers for overall violent crime remain similar for 2022 and 2023, with small decreases in most numbers “or” rates except for robberies, simple assault (the majority of violent crimes), and stranger violence. Vehicle thefts continued to increase.
Per the NCVS, households in the United States experienced 13.6 million property victimizations in 2023. The number of property victimizations was comparable to the number in 2022 but higher than the 12.8 million in 2019. Property crime includes burglary or trespassing, motor vehicle theft, and other types of household theft.
Report From the National Crime Victimization Survey for 2024
The Bureau of Justice Statistics, in the Department of Justice’s Office of Justice Programs, released Criminal Victimization on September 29, 2025.
4.
A Discussion Regarding Historic Lows In Crime

We had over 20 years of decline in crime before violence began to rise in 2011-2012 with some years of increases and some years of decreases after.
Violent crime and serious violent crime increased by 28 percent over three years (2015-2018), per the Bureau of Justice Statistics-National Crime Victimization Survey. The violent crime rate had declined for nearly two decades before increasing in 2011 and 2012. FBI data indicates that violence began to rise in 2012.
You will hear from a variety of sources that current violence is far below that of previous decades, which is true, yet fear of crime (see below) is currently high.
There is also data indicating that most Americans are victimized by crime each year, including violent, property, identity theft, and cybercrimes. Repeat victimizations may have an impact on understanding these numbers.
Tens of millions of Americans are victimized by violent and property crimes, cybercrime, and identity theft every year.
Data from the National Crime Victimization Survey states that we were at record historical lows for criminal activity. From 1993 to 2015, the rate of violent crime declined from 79.8 to 18.6 victimizations per 1,000 persons age 12 or older.
From 1993 to 2021, the rate of violent victimization declined from 79.8 to 16.5 victimizations per 1,000 persons age 12 or older.
According to FBI numbers, the violent crime rate fell 48 percent between 1993 and 2016. Using data from the Bureau of Justice Statistics (National Crime Victimization Survey), the rate fell by 74 percent during that span.
6.
Latest Crime Data From Researchers Using Big City Police Crime Dashboards
Homicides and Shootings Are Down?
Note that the latest USDOJ National Crime Victimization Survey data for 2022 indicates that violent crime increased by 44 percent (to my knowledge, the largest increase in violent crime ever recorded). Rates for violence are essentially unchanged for 2023 and 2024 (latest report). The NCVS also states that violent crime increased in urban areas.
What you will read below from multiple sources deviates from the findings of the USDOJ’s National Crime Victimization Survey. They rely on crimes reported to law enforcement, and as stated, the great majority of what we call crime is not reported to the police.
However, that does not mean to imply that the data offered below is incorrect. As of this writing, there are a multitude of cities offering reductions in crime rates and numbers. Homicides, shootings, and overall violent crimes are down considerably in many cities.
There are times when crime data is confusing, and in many cases, it depends on the source and how numbers are collected and presented. There are endless reasons as to why people do not report their victimizations to law enforcement; thus, reported crime findings will differ from total crime findings.
2024-2025-2026 Crime Summations From Jeff Asher
See analyst Jeff Asher’s latest reports indicating that there are significant reductions in reported crime for 2024, 2025, and 2026. He includes summaries of national FBI reports and an analysis of emerging trends based on big-city crime dashboards. I recommend his work. He also includes summaries of FBI preliminary reports.
Recommended Reports:
2023-2026 Summaries From the Council On Criminal Justice
The Council on Criminal Justice is another reputable source examining crime from big city dashboards and national data from the FBI. I recommend their work. I recommend that you sign up for updates.
Recommended Reports:
- Crime Trends in U.S. Cities, Mid-Year 2026 Update
- 2025 Yearly Crime Summation From The Council On Criminal Justice
- 2024 Yearly Crime Summation From The Council On Criminal Justice
- 2023 Yearly Crime Summation From The Council On Criminal Justice
Note: Much of the 2023 study was inaccurate compared to the 2023 results from the FBI.
The Major Cities Chiefs Association
2026 Preliminary Violent Crime Summary From The Major Cities Chiefs Association.
Click on the link above for a list of violent crimes in individual American and Canadian cities. The chart below is a yearly summation.
The majority of cities are reporting overall declines in violent crime. However, most cities have seen increases in at least one category of violent crime. The link above will take you to the list of individual cities
The Major Cities Chiefs Association has been offering violent crime statistics for a longer period of time than any other organization beyond the FBI. Because it’s considered to be a reliable source of overall violent crime as well as a record of individual cities, I recommend their work.
Considering that major city police chiefs are offering the work of their crime analysts, I make the assumption that their data is correct.
FBI’s New Method Of Collecting and Reporting Crime Data-The National Incident-Based Reporting System
See below for summaries of FBI yearly statistics.
See here for the official explanation of the NIBRS from the FBI.
See here for a Congressional report.
See here for an article on the issues regarding the National Incident-Based Reporting System.
See Millions Of Crimes Are Not Included In FBI Yearly Reports. There is an overview of federal and state data indicating that the majority of crime incidents involve multiple charges, based on a survey from Harvard Law School. Multiple charges per crime incident are common. It indicates that there may be millions of crimes (charges) not reported in the FBI’s national crime statistics, which offer only the most serious crime per incident.
All NIBRS data, however, is used for topical reports on crime.
The emphasis of the National Incident-Based Reporting System is to create a comprehensive and qualitative overview of crime in the US. It will be a vast improvement over previous reports.
The National Incident-Based Reporting System includes multiple crimes connected to an incident, not just the most serious crime used in the old Summary Reporting System; thus, more crimes are recorded.
Per an FBI estimate, 11 percent of all criminal episodes involved multiple offenses (editor’s note: it’s obviously more than that: See Millions Of Crimes Are Not Included In FBI Yearly Reports). However, the NIBRS offers far more categories of crime than the older Summary Reporting System.
The National Incident-Based Reporting System is supposed to be the only reporting system used for national crime data.
Per the FBI, full-year data from 2022–2026 was a mix of reports from the old and new reporting systems.
Current NIBRS Status
In 2025, 77.2% (15,099) of agencies submitted crime data via NIBRS. Unlike the older Summary Reporting System (SRS), NIBRS agencies can report up to 10 offenses occurring within a single incident. NIBRS also provides a multitude of additional data elements describing the details of each incident, including incident date and time, involved weapons, particulars on stolen or damaged property, sustained injuries, and demographics on victims, offenders, and arrestees. NIBRS publication tables aggregate some offenses into categories.
Law enforcement agencies submitted NIBRS data either through a state Uniform Crime Reporting Program (UCR) or directly to the FBI. All 50 states are NIBRS certified and are submitting their agencies’ crime data via NIBRS. Additionally, the UCR Program has two agencies in the District of Columbia and one in the territory of Guam that directly report UCR data through NIBRS.
Analyst Jeff Asher provided an update of police agency participation in the FBI’s Incident-Based Reporting System in March of 2024. It seems that larger agencies are reaching 80 percent participation, while smaller police agencies are still far behind (a little over 50 percent).
Currently, the National Incident-Based Reporting System covers the vast majority of the US population.
8.
A Focus On The Bureau of Justice Statistics’ (BJS) National Crime Victimization Survey-NCVS
Why do I write about the National Crime Victimization Survey? Because it’s probably the best count of “all” crimes, not just reported crimes, as offered by the FBI. However, their reports are often ignored because few are familiar with the survey. It has a 50-year history of analyzing crime.
The survey does not collect data on homicides (you can’t interview dead people). It does not collect information on business crimes. It offers a separate report on identity theft crimes (as does the FBI).
See below for summaries of the National Crime Victimization Survey yearly statistics.
See Is Violence Rising Or Falling? Understanding Quirks Within the National Crime Victimization Survey for the full article addressing the complexities of National Crime Victimization Survey Data.
The vast majority of crimes are not reported to law enforcement. Approximately 48% of violent victimizations were reported to police in 2024, which was not significantly different from the percentage in 2023.
A three-year summation by the NCVS puts it at 38 percent. It’s much less for property crimes (30 percent), thus the need for a national survey to count “all” crimes.
The survey uses a methodology similar to the US Census. The US Census and the USDOJ’s Bureau of Justice Statistics state that the NCVS is the nation’s premier count of crimes in the US. During its creation, the media and the criminological community were strongly in favor of a national survey because of the lack of reporting of crimes to law enforcement.
It’s a series of yearly documents that began in 1973 and includes statistics on nonfatal violent crimes (rape or sexual assault, robbery, aggravated assault, and simple assault) and property crimes (burglary or trespassing, motor vehicle theft, and other types of household theft).
The report also describes the characteristics of crimes and victims. The survey also offers special reports on a variety of crimes beyond those usually counted.
Annual National Criminal Victimization Survey estimates are based on the number and characteristics of crimes that respondents experienced during the prior 6 months, excluding the month in which they were interviewed.
Some suggest that crimes reported to law enforcement (as compiled by the FBI) are “important” enough to call the police, and that surveys count the “real” number of crimes.
People do not report crimes to the police for an endless number of reasons; one is that most violent crime happens among people who know each other.
Your drunk friend could hit you with a beer bottle (an aggravated assault), but you choose to handle it personally. But when the National Crime Victimization Survey calls and asks about recent victimizations, you tell them about the assault (there is no effort to identify the offender).
Both the FBI and the Bureau of Justice Statistics release separate full-year crime reports in the late summer or fall for the preceding year; thus, both release what is essentially old data, yet the FBI’s crimes reported to law enforcement will get significantly more media coverage because people are more familiar with it. In August of 2025, the FBI stated that it would begin monthly reports.
It would take pages to describe the challenges both agencies are having with their crime statistics. I’ll summarize with the observation that the FBI moved to a new, comprehensive, and robust reporting system (National Incident-Based Reporting System), but a few local law enforcement agencies in 2024-2025-2026 haven’t completed their adoption.
The Bureau of Justice Statistics redesigned how it collects data through the National Crime Victimization Survey (redesign reports are available on its website).
My description here of the complexities is woefully understated; see below for more.
What’s Wrong With The National Crime Victimization Survey?
The short answer is nothing. The world of survey research is complex, even more so because of the pandemic, with numerous references from major polling organizations changing survey strategies.
As stated above, the National Crime Victimization Survey is contemplating a routine redesign after 50 years of service. There have been previous redesigns.
The National Crime Victimization Survey is necessary because the vast majority of violent and property crimes are unreported to law enforcement. To gain an understanding of “all” crime, a national survey is imperative.
The National Crime Victimization Survey offers significantly larger numbers of crimes than those reported to law enforcement and in national reports issued by the FBI. Generally speaking, the larger the numbers, the more accurate the results.
The National Crime Victimization Survey offers separate reports giving readers a qualitative assessment of dozens of variables about crime. Through these documents, we gain a fairly decent sense of who’s victimized, data on criminal offenders, and additional issues.
But the National Crime Victimization Survey, like all polling data, has its imperfections and disagreements with other national reports on crime.
There are times when other authoritative crime data indicate that crime is decreasing, whereas the National Crime Victimization Survey states that crime is increasing.
There are times when other authoritative crime data indicate that crime is increasing, while the National Crime Victimization Survey states that crime is decreasing.
No one is suggesting that the data is incorrect, just different than what’s offered by other sources.
Readers need to understand this and compare multiple sources to gain the best possible understanding of crime in the United States.
The Rest Of This Report
The rest of this report focuses on:
Groups impacted by crime
Fraud, identity theft
Fear of crime
Data from Gallup.
9.
Groups Impacted Most By Crime? Data On Victims Of Crime And Violence
Note: The best explanation as to who is victimized by crime is offered by the latest edition of the National Crime Victimization Survey. Younger people, people in urban areas, males, and low-income groups are victimized the most.
Note: I could include a new report daily as to who’s impacted, but most of the data below seems representative of the current victimization experience. Some of the sources below are based on older data, yet I’m confident that the research as presented remains accurate today.
Examples:
Estimates indicate that around one in every 38 Black men and one in every 287 Black women will die at the hands of a firearm, based on new data from the RAND Corporation. See New Data On Black Communities and Firearm Violence.
While Blacks account for 14% of the U.S. population, they comprise 60% of those killed by firearm homicides annually, according to an analysis published in February by the Brady Center to Prevent Gun Violence. The study, based on data from the Centers for Disease Control and Prevention from 2017 to 2021, showed that Black males aged 18 to 24-years-old are 23 times more likely to die by firearm homicide than their white male peers. ABC News.
The number of children and teens killed by gunfire in the United States increased 50% between 2019 and 2021, according to a Pew Research Center analysis of the latest annual mortality statistics from the Centers for Disease Control and Prevention (CDC). In 2021, 46% of all gun deaths among children and teens involved Black victims, even though only 14% of the U.S. under-18 population that year was Black. Homicide was the largest single category of gun deaths among children and teens in 2021, accounting for 60% of the total that year, Pew.
The victims and suspects of homicides and nonfatal shootings in the District of Columbia are primarily male, Black, and between the ages of 18 and 34. Nearly 92 percent of victims and suspects in homicides and 88 percent of victims and suspects in nonfatal shootings were male. About 96 percent of victims and suspects in both homicides and nonfatal shootings were Black, despite Black residents comprising 46 percent of the overall population in the District. Approximately 66 percent of homicide victims/suspects and 64 percent of nonfatal shooting victim/suspects were between the ages of 18 and 34, with a mean age of 29.5 and 29.8, respectively. Across homicides and shootings, both victims and suspects are demographically similar overall, DC Criminal Justice Coordinating Council.
News reports suggest that the cities where protests and/or riots responding to police use of force occurred were impacted the hardest by crime, Governing.Com.
It’s African American communities that are bearing the brunt of violence, NBC News.
The highest homicide gun death rates continue to be in young Black men, at 142 per 100,000 for those in their early 20s, according to the Associated Press. Among Black women, the rate of firearm-related homicides has more than tripled since 2010, and the rate of gun-related suicides has more than doubled since 2015.
The number of children shot in New York City has doubled since 2017. That year, 75 shooting victims were children. By mid-December of 2022, at least 149 children had been shot. New York Times.
The rise in violent crime across the U.S. has been concentrated in “low-income communities of color” which have disproportionately experienced the impact of school closures and reductions in basic services during the pandemic, according to a study by the University of California, Davis Violence Prevention Research Program, The Crime Report.
In certain U.S. cities, young men are over three times more likely to be shot dead than American soldiers deployed to war zones in the Middle East, new research reveals. The researchers looked at the demographics of the young men in the zip codes under investigation, and they found that the risk of violent death and injury was almost entirely tied to individuals from minority racial and ethnic groups. Black and Hispanic males represented 96.2 percent of those who were fatally shot and 97.3 percent of those who experienced non-fatal gun injuries across all four cities.
There were 722 more homicides in nine U.S. cities last year, according to police data. More than 85% of the increase was in predominantly Black and Hispanic neighborhoods, according to The Marshall Project.
Black males were overwhelmingly the No. 1 demographic killed in most cities. In Chicago, which tallied the most homicides since 1996, 648 of the city’s 797 homicide victims were Black. In Baton Rouge, Louisiana, 105 of the city’s 133 homicides were Black males. In Columbus, Ohio, 135 of the city’s 204 homicides were of Black males. In Louisville, Kentucky, 133 of the city’s 197 homicide victims were Black males. In St. Paul, Minnesota, 17 of the city’s 38 homicides were of Black males. Chicago’s most vulnerable neighborhoods, ones that have borne the disproportionate brunt of gun violence throughout the city, reports the Chicago Tribune. The increases have reached a point where the homicide rate in the most violent parts of the city at the end of 2020 was higher than it was in those places in 1991, a year often considered one of the most violent years in Chicago history. In Los Angeles, 397 people were killed in 2021 — the most in a year since 2007.
Hispanic males were the top demographic killed in L.A. last year, 183 in total, in a city that has a much larger Hispanic than Black population, Fox News.
Gun violence has particularly affected young people this year. Nearly 300 children ages 11 and younger were killed, and more than 660 were injured, says the Gun Violence Archive. Among teens ages 12 to 17, more than 1,000 were killed, and nearly 3,000 were injured.
Gun homicides involving intimate partners rose 25% in 2020, compared with the previous year, to the highest level in almost three decades, newly analyzed FBI data reveals, The Guardian.
10.
Fear of Crime
I spoke to an analyst regarding national crime statistics, who told me that crime data was irrelevant. The most important indicator of crime in the United States was the fear of crime.
Note that previous entries to this section have been removed due to age, archived articles, and updated Gallup statistics.
What’s below is based on Fear Of Crime Continues To Decline in 2026 Per Gallup, published in April 2026.
Overview
In 2023, fear of crime was at record levels, according to Gallup. Now, Gallup states that fear has declined over the last three years. Some suggest that fear of crime measures are more important than crime statistics and play a major role in the economics and well-being of cities.
Those who worry a great deal about crime (there are other categories of fear-see below) was 53 percent in 2024, 47 percent in 2025, and 39 percent in 2026.
By political identification, those who worry a great deal in 2026: Republicans, 41 percent; Independents, 41 percent; and Democrats, 33 percent. Note that, per polls, more people identify as Independent than as aligned with a major party. Other polls indicate that fear of crime among Democrats is high (forthcoming).
Per Gallup, Meaningful drops this year in Americans’ concern about crime (-8 points) and immigration (-7) largely reflect reduced worry among Republicans and bring these figures to their lowest levels since at least 2020.
In 2025, 49% viewed crime as a serious problem. 38 percent said it is “moderately serious,” meaning that fear of crime is still very high if you add other categories.
Chart

Chart

National Priorities
If you follow national priorities (using a different set of criteria), the numbers regarding crime and related issues are concerning. Per Pew, (2024), improving the job situation, improving the energy situation, protecting the environment, dealing with problems affecting poor people, improving transportation, improving the military, addressing climate change, addressing race issues, and global trade all rank lower than crime as American priorities.
National priority issues related to crime remain highly important, according to Pew. Terrorism came in as second, reducing crime was 7th, dealing with illegal immigration was 8th, and reducing the availability of illegal drugs was 9th.
Gallup’s Global Crime And Fear Index (2025)
This is a separate and recent report from Gallup. Fear of crime decayed for the US and Canada (it’s mostly a US finding based on population and methodology). Most countries saw improvements in perceptions of crime.
On a global level (excluding North America and parts of Africa), people feel safer today than they have in years.
For the current four-question Law and Order Index in 2024, focusing on crime and fear, the US ranked 54th out of 144 countries. Eight countries had the same score as the US; thus, the United States had a de facto rank of 46.
The United States ranked 64th solely using “Do you feel safe walking alone at night in the city or area where you live?” Iraq, Bangladesh, Bulgaria, Libya, Albania, and multiple other countries scored higher than the US. Four countries had the same score as the US; thus, the United States had a de facto rank of 60.
The Highest Rate Of Fear Of Crime Was In 2023
Nearly two-thirds of Americans believe crime was an “extremely” or “very” serious problem in the U.S., according to a Gallup poll in November 2023. The 63 percent rate is the highest collected by Gallup, with the previous high of 60 percent found in 2000, 2010, and 2016.
A small proportion of respondents considered crime extremely serious in their local communities — 17 percent — but more than half of them believe crime has gone up in their area. Nationally, about three-quarters of Americans believed crime has gone up, underlining the tough-on-crime political narrative of conservative politicians.
Context-Other Sources
Being Victimized
Overall, Americans worry most about being the victim of identity theft (69%) and being tricked into providing financial information to scammers (53%). These are the only crimes included in the survey about which majorities say they worry frequently or occasionally.
Meanwhile, 43% of all U.S. adults worry about a school-aged child of theirs being physically harmed at school, but this rises to 60% of parents of school-aged children.
Fewer Americans say they worry about crimes, such as having a car stolen (39%), their home burglarized (34%), being a victim of a hate crime (30%), or getting mugged (29%), attacked while driving (27%), murdered (22%), or sexually assaulted (21%). Yet collectively, violent and property crimes far outweigh the top three categories.
Gallup’s Bottom Line
Americans’ views of crime in the U.S. have improved notably for the third year, reversing the pessimism seen earlier in the decade. Less than half now describe such crime as a very or extremely serious problem, or believe it has risen in the past year.
Perceptions have brightened across nearly all demographic subgroups, and assessments of local crime have followed, as far fewer adults report increases in crime where they live and a growing share feel safe walking alone at night.
These shifts mark a continued return to the more positive attitudes last seen in the early 2000s, suggesting the public sees national crime conditions stabilizing after several years of heightened unease.
Still, Americans’ improved assessments of national and local crime do not eliminate personal anxiety about victimization. A majority of adults remain worried about being targets of financial crimes such as identity theft or scams, and parents continue to fear for their children’s safety at school.
Conclusions
The criminological literature is very clear: fear of crime concerns can destroy cities; the psychological well-being of citizens, test scores of students, economic development, and jobs are all impacted.
Criminology also states that people judge their concerns about crime based on a variety of variables, including signs of disorder, media reports, young people hanging out in the community, graffiti, or any other condition that makes citizens uncomfortable. Official crime counts are not nearly as important as what people feel about the conditions in or near their communities.
To some observers, fear or concerns about crime may be the most important index of crime in America.
Data indicate that an increased police presence lowers fear, but that’s challenging because of a loss of police officers and long response times in some cities.
Fear Of Crime Among Groups
42% Of Black Adults Say Crime Is A Major Problem. Some 43% of urban residents now say crime is a major problem in their community, compared with 35% in 2018. Needless to say, Pew addressed “major” problems. If we included “problems” with crime and violence, the percentage would be much higher, Pew.
Latinos say crime and gun violence is their number two concern — behind COVID-19 and before immigration, social justice or voting rights — in our inaugural Axios-Ipsos Latino Poll in partnership with Noticias Telemundo, Axios
About eight in ten Asian Americans say violence against them is increasing in the U.S., a 2021 survey found.
From Rand: Women’s personal ownership of firearms increased substantially in recent years. After more than a decade of stable gun ownership, women’s ownership rose starkly between 2018 and 2021, going from 10 percent of adult women owning guns in 2018 to 15 percent in 2021, then up again slightly to 16 percent by 2024. Other national surveys, such as Pew’s American Trends Panel, report similar trends in women’s gun ownership over this period (although prevalence estimates differ from GSS, likely due to differences in question wording and sampling). Over the same period, men’s gun ownership remained relatively flat; the percentage of men who own guns as of 2024 (36 percent) is now quite a bit lower than the ownership rate from two decades prior (40 percent).
11.
Fraud, Identity Theft, and Digital Crimes
Per Gallup-Identity Theft And Scams Happen Far More Often Than All FBI-Reported Crimes
Six percent of Americans report being personally scammed in 2025, with those scams costing U.S. adults an estimated $68 billion — more than four times what was reported to federal authorities in FTC complaint data in 2025.
About one in four Americans (24%) have been personally scammed at some point in their adult life, and one in 10 have been scammed more than once.
Scam attempts are pervasive: About four in 10 (41%) Americans are contacted by an attempted scam daily.
Nearly half of individuals (46%) say their household experienced at least a moderate financial hardship as a result of being scammed, including 21% who say it was a severe hardship.
Lower-income households were most likely to be meaningfully impacted, with almost six in 10 (58%) of these households saying the scam created a severe (28%) or moderate (30%) financial hardship.
The emotional toll of being scammed may be just as heavy as the financial one. Nearly three-quarters of individuals who say they or their household experienced a scam in 2025 say it had a negative impact on their mental health or well-being.
Qualitative interviews indicate that many individuals felt the emotional impacts outweighed the financial ones.
The most common entry points for scams were online purchases, phone calls, and social media.
Scam victims report that most of the communications with the scammer took place via phone calls, text messages and email.
Most scams are reported to banks, with fewer going to federal agencies and law enforcement. While 79% of victims say they told at least one entity about the scam, only 13% reported it to either the FTC or federal law enforcement, leaving these agencies without the data needed to fully identify the scope of scam victimization in the United States.
Virtually all adults (98%) believe scams pose a threat to individuals in the U.S., with two-thirds saying the threat is “major.” The vast majority of U.S. adults (82%) think the government is doing too little to prevent scams.
An Estimated 15 Million Americans Were Victimized in 2025 Alone
In 2025, 6% of U.S. adults — or an estimated 15.1 million — say they were personally scammed out of money.
An additional 4% of U.S. adults told Gallup that another person in their household was scammed in 2025, leading to a total of 10% of those surveyed who said they or a household member was scammed in 2025.
The incidence of scams varies across some demographic groups, with higher scam rates reported among lower-income adults, people of color and those without a bachelor’s degree. Scam victimization rates are similar across different age cohorts.
Two-Thirds of Americans Say Scams Are a Major Threat
Virtually all adults (98%) believe scams pose a threat to individuals in the U.S., with two‑thirds (66%) saying they are a major threat and an additional 32% saying scams are a minor threat.
Older adults are notably more alarmed: 80% of those aged 60 and older say scams are a major threat, compared with 68% of 40- to 59-year-olds and 51% of 18‑ to 39-year-olds.
Conclusions
Per Gallup’s numbers, crime in the form of identity theft and scams massively outweighs all crimes reported to the FBI.
The question is whether crime is shifting in the US from street-level infractions to digital offenses. There is growing evidence that a portion of criminal activity may be shifting from traditional street offenses toward cyber-enabled fraud and scams.
One could make the case, based on the National Crime Victimization Survey and Gallup, that crime is not receding in the US; it’s just taking on different forms of victimization.
That level of victimization leads to greater fear of crime.
Bureau Of Justice Statistics
23 Million Americans Are Victims Of Identity Theft Costing Over 15 Billion Dollars, 2022, Bureau of Justice Statistics.
Per Gallup (2016), beyond the 29 percent of households victimized by violent and property crimes, 27 percent of households had their credit card stolen by hackers, and 17 percent of households were victims of identity theft.
Gallup refers to these figures as a direct experience with crime.
Per the FBI in 2024, cybercrimes almost doubled between 2019-2023.
12.
Gallup Data On Crime
There are three traditional sources for violence and crime in the US: the FBI’s Crime Reports, the Bureau of Justice Statistics National Crime Survey, and Gallup.
There are endless additional sources on crime (Pew, the CDC, the federal Office of Juvenile Justice and Delinquency Prevention, private research firms, and many others) that are used throughout this report, but our focus is on the data most often referred to when discussing crime.
See the “Fear of Crime” section of this article. Per Gallup, fear of crime was at near-record high levels in 2023.
Gallup’s historical crime data is a good starting point.
Gallup’s latest crime articles are must-reads.
See Per Gallup-Confidence In American Police Exceeds Most Other Institutions
See 30 Percent Of Urban Households Victimized By Crime In 2021
See Americans More Critical of U.S. Criminal Justice System. Gallup in 2023: A 58% majority of Americans think the U.S. criminal justice system is not tough enough in its handling of crime, marking a sharp reversal from the prior reading in 2020 when a record-low 41% said the same. Another 26% of U.S. adults currently say the system is about right, while 14% think it is too tough.
Gallup also states that in 2023, 52 percent of American Households have firearms.
13
FBI and National Crime Victimization Survey Data Plus Links
Brief Summation-FBI-Crimes Reported To Law Enforcement Based On Final-Official Reports-Focus Is On Violent Crime-2025 to 2012
2025-Violent crime decreased by an estimated 9.3%. Homicides decreased by an estimated 18.1%. Rape decreased by an estimated 7.6%. Robbery decreased by an estimated 18.5%. Aggravated assaults decreased by an estimated 7.2%. Property crime decreased by an estimated 12.4%.
2024-Violent crime decreased by an estimated 4.5%. Murder and nonnegligent manslaughter decreased by an estimated 14.9%. Rape decreased by an estimated 5.2%. Robbery decreased by an estimated 8.9%. Aggravated assault decreased an estimated 3.0%. Property crime decreased by an estimated 8.1%
2023-Violent crime decreased 3.0%. Murder and non-negligent manslaughter recorded a 2023 estimated nationwide decrease of 11.6%. The rape category saw an estimated 9.4% decrease. Aggravated assault decreased an estimated 2.8%. Robbery showed a decrease of 0.3%. Hate crime incidents decreased 0.6%. Property crime was down by 2.4 percent.
2022-The FBI offers 12 categories of crimes (13 including hate crimes). Four categories decreased, six categories increased, and one (burglary) was flat. The FBI’s crime statistics estimates for 2022 show that national violent crime decreased by an estimated 1.7% in 2022 compared to 2021 estimates. Murder decreased by 6.1%. Rape decreased by an estimated 5.4%. Aggravated assault decreased by an estimated 1.1%. Robbery increased by an estimated 1.3%. The property crime rate increased considerably for the first time since 2012.
2021—Analysts urge caution for use of 2021 FBI data. For 2021, the FBI used a special NIBRS-based estimation method because 2021 was the first year in which NIBRS became the national reporting standard. Overall, violence in the nation was flat, with a decrease of 1.0 percent. Homicides increased by 4.3 percent in 2021. Rapes increased by 3.4 percent. Robbery decreased by 8.2 percent. Aggravated assaults decreased by 0.1 percent
2020-The number of homicides increased by nearly 30% from 2019. In 2020, violent crime was up 5.6 percent.
2019-Violent crime was flat ( decreased 0.5 percent) in 2019.
2018-Violent crime decreased by 3.3 percent in 2018.
2017- Violent crime decreased by 0.2 percent in 2017.
2016-Violent crime increased in 2016.
2015-Violent crime increased in 2015.
2013-2014-Violent crime decreased in 2013 and 2014.
2012—Lowest murder rate since 1960, but violent crime increased in 2012.
Brief Summation—National Crime Victimization Survey—Focus Is On Violent Crime—2011 to 2025
In 2022, 2023, and 2024, violent crime statistics were virtually unchanged. In 2022, there was a 44 percent increase in violent crime, according to researchers.
2021-The Bureau of Justice Statistics (BJS) states that the violent victimization rate increased from 19.0 to 24.5 victimizations per 1,000 persons in urban areas while remaining unchanged in suburban or rural areas. The rate of serious violent victimization in urban areas also increased. Overall violence for the nation was flat.
2020-The Bureau of Justice Statistics (BJS) states that the violent victimization rate dropped 22 percent in 2020.
2019- There was no statistically significant change in the number or rate of total violent victimizations from 2018 to 2019, including simple assault. The National Crime Victimization Survey states the rate of violent crime excluding simple assault declined 15% in 2019. However, new data from Criminal Victimization-2020 indicates that the numbers and rates for violent crime decreased in 2019, contradicting what they previously said.
2018-Violent Crime: From 2015 to 2018, the total number of violent victimizations increased by 28%. The rate of total violent victimizations also increased. The number of violent incidents increased from 5.2 million in 2017 to 6.0 million in 2018. Serious violent crime increased. Property crime continues to decrease.
2017-For the second straight year, the number of victims of violent crime was higher than in 2015. Most of the sixteen categories of violent crime rates increased from 2015 to 2017. Some were flat. Three decreased. Property crime decreased.
2016-Categories of violent crime increased. Property crime increased for the first time since 2013. There was no statistically significant change in the rate of overall violent crime from 2015, yet the rate increased (18.6 victimizations per 1,000 persons age 12 or older) to 2016 (19.7 per 1,000).
2015—Violent crime flat; property crime decreased.
2014-Violent and property crime declined.
2013-Violent and property crime declined.
2011-2012-The violent crime rate had declined for nearly two decades before increasing in 2011 and 2012.
14.
FBI-Crimes Reported to Police-Extended Summary of Recent Years Based on Final Official Reports-Focus Is On Violent Crime
2025: Estimated violent crime offenses consist of murder and nonnegligent manslaughter, rape, robbery, and aggravated assault. Nationwide, from 2024 to 2025, the estimated volume of violent crime offenses showed the following changes: Violent crime decreased by an estimated 9.3%. Murder and nonnegligent manslaughter decreased by an estimated 18.1%. Rape decreased by an estimated 7.6%. Robbery decreased by an estimated 18.5%. Aggravated assault decreased by an estimated 7.2%. An estimated 1,119,768 violent crime offenses were committed in 2025, indicating an estimated offense rate of 327.6 violent crimes per 100,000 inhabitants, down from the 2024 estimated offense rate of 362.9 violent crimes per 100,000 inhabitants. In 2025, law enforcement agencies made an estimated 413,991 arrests for violent crime offenses. Since the FBI began estimates in 1936, the United States has recorded its largest year-to-year decreases in both the estimated violent crime rate and the estimated murder and nonnegligent manslaughter rate. Estimated property crime offenses consist of burglary, larceny-theft, and motor vehicle theft. Nationwide, from 2024 to 2025, the estimated volume of property crime offenses showed the following changes: Property crime decreased by an estimated 12.4%. Burglary decreased by an estimated 15.8%. Larceny-theft decreased by an estimated 9.8%. Motor vehicle theft decreased by an estimated 22.7%. An estimated 5,245,768 property crime offenses were committed in 2025, indicating an estimated offense rate of 1,534.8 property crimes per 100,000 inhabitants, down from the 2024 estimated offense rate of 1,761.1 property crimes per 100,000 inhabitants. Estimated property crime arrests include burglary, larceny-theft, motor vehicle theft, and arson offenses. In 2025, law enforcement agencies made an estimated 868,330 arrests for property crime offenses.
2024: Violent crime decreased an estimated 4.5%. Murder and nonnegligent manslaughter decreased an estimated 14.9%. Rape decreased an estimated 5.2%. Robbery decreased an estimated 8.9%. Aggravated assault decreased an estimated 3.0%. An estimated 1,221,345 violent crime offenses were committed in 2024, indicating a rate of 359.1 violent crimes per 100,000 inhabitants, down from the 2023 estimated offense rate of 379.5 violent crimes per 100,000 inhabitants. An estimated 419,423 arrests for violent crime offenses were made in 2024. Property crime consists of burglary, larceny-theft, and motor vehicle theft. Nationwide, from 2023 to 2024, the estimated volume of property crime offenses showed the following changes: Property crime decreased an estimated 8.1%. Burglary decreased an estimated 8.6%. Larceny-theft decreased an estimated 5.5%. Motor vehicle theft decreased an estimated 18.6%. An estimated 5,986,400 property crime offenses were committed in 2024, indicating an offense rate of 1,760.1 property crimes per 100,000 inhabitants, down from the 2023 estimated offense rate of 1,934.1 property crimes per 100,000 inhabitants. An estimated 910,654 arrests for property crime offenses were made in 2024.
2023: The FBI’s crime statistics estimates, based on reported data for 2023, show that national violent crime decreased an estimated 3.0% in 2023 compared to 2022 estimates. Murder and non-negligent manslaughter recorded a 2023 estimated nationwide decrease of 11.6% compared to the previous year. In 2023, the estimated number of offenses in the revised rape category saw an estimated 9.4% decrease. Aggravated assault figures decreased an estimated 2.8% in 2023. Robbery showed an estimated decrease of 0.3% nationally. Reported hate crime incidents decreased 0.6% from 10,687 in 2022 to 10,627 in 2023. There was an overall decrease in property crime of 2.4%. Burglary decreased 7.6%. Larceny decreased 4.4%. Motor Vehicle Theft increased 12.6%.
2022: The FBI offers 12 categories of crimes (13 including hate crimes). Four categories decreased, six categories increased and one (burglary) was flat. Hate crimes increased. The FBI’s crime statistics estimates for 2022 show that national violent crime decreased an estimated 1.7% in 2022 compared to 2021 estimates. Murder and non-negligent manslaughter recorded a 2022 estimated nationwide decrease of 6.1% compared to the previous year. In 2022, the estimated number of offenses in the revised rape category saw an estimated 5.4% decrease. Aggravated assault in 2022 decreased an estimated 1.1% in 2022. Robbery showed an estimated increase of 1.3% nationally. The property crime rate increased considerably for the first time since 2012. The rate of arson increased considerably. The rate for burglaries was flat. The rate for larcenies-thefts increased The rate of motor vehicle thefts increased considerably. The FBI reported a 6.9% increase in hate crimes from 2021 to 2022 and a rise in law enforcement participating in reporting, Axios. Associated Press-The Estimated Number Of juvenile Victims Of Fatal Gun Violence Rose 11.8 Percent
2021: Analysts urge caution for use of 2021 FBI data. For 2021, the FBI used a special NIBRS-based estimation method because 2021 was the first year in which NIBRS became the national reporting standard. Based on 52 percent of law enforcement agencies providing a full year of data for the FBI’s new National Incident-Based Reporting System, overall, the analysis shows violent and property crimes remained consistent between 2020 and 2021. While the aggregate estimated violent crime volume decreased 1% for the nation from 1,326,600 in 2020 to 1,313,200 in 2021, the estimated number of murders increased from 22,000 in 2020 to 22,900 in 2021. The increase in murders constitutes a 4.3% increase. The robbery rate decreased 8.9% from 2020 to 2021, which heavily contributed to the decrease in overall violent crime despite increases in murder and rape rates at the national level.
2020: Per FBI final statistics released in September 2021, the number of homicides increased nearly 30% from 2019, a total not seen since the mid-1990s.In 2020, violent crime was up 5.6 percent from the 2019 number. The estimated number of aggravated assault offenses rose 12.1 percent, and the volume of murder and nonnegligent manslaughter offenses increased 29.4 percent. The estimated number of robbery offenses fell 9.3 percent and the estimated volume of rape (revised definition) offenses decreased 12.0 percent. Property crimes continued to decrease. Motor vehicle thefts rose 11.8 percent.
2019: For all of 2019, violent crime was flat (-0.5 percent), and property crime was down 4.1 percent. The violent crime rate was down 1.0 percent, and the property crime rate was down 4.5 percent. Aggravated assaults (the vast majority of reported violent crimes) were up 1.3 percent. Homicides were flat-up 0.3 percent.
2018: Violent crime declined 3.3 percent between 2017 and 2018. Property crime decreased 6.3 percent during the same time period
2017: After two consecutive years of increases, the estimated number of violent crimes in the nation decreased by 0.2 percent in 2017 when compared with 2016 data, according to FBI figures. Property crimes dropped 3.0 percent, marking the 15th consecutive year the collective estimates for these offenses declined.
2016: For all of 2016, the estimated number of violent crimes in the nation increased for the second straight year, rising 4.1 percent in 2016 when compared with 2015 data, according to FBI figures. Property crimes dropped 1.3 percent, marking the 14th consecutive year the collective estimates for these offenses declined. In 2016, there were an estimated 1,248,185 violent crimes. Murder and nonnegligent manslaughter offenses increased by 8.6 percent when compared with estimates from 2015. Aggravated assault and rape (legacy definition) offenses increased 5.1 percent and 4.9 percent, respectively, and robbery increased 1.2 percent.
2015: After two years of decline (reported crime was mostly flat in 2014 with a slight decrease), the estimated number of violent crimes in the nation increased 3.9 percent in 2015 when compared with 2014 data, according to FBI figures. Property crimes dropped 2.6 percent, marking the thirteenth straight year the collective estimates for these offenses declined. In 2015, there were an estimated 1,197,704 violent crimes. Murder and nonnegligent manslaughter increased 10.8 percent when compared with estimates from 2014. Rape (legacy definition) and aggravated assault increased 6.3 percent and 4.6 percent, respectively, while robbery increased 1.4 percent.
2014: The FBI reports preliminary figures indicating that law enforcement agencies throughout the nation showed an overall decrease of 4.6 percent in the number of violent crimes for the first 6 months of 2014 when compared with figures reported for the same time in 2013. The violent crime category includes murder, rape, robbery, and aggravated assault. The number of property crimes in the United States from January to June of 2014 decreased by 7.5 percent when compared with data for the same time period in 2013.
However, when the FBI released its full report for 2014, the estimated number of violent crimes in the nation decreased by 0.2 percent in 2014 when compared with 2013 data. Aggravated assaults and rapes increased. Property crimes decreased by 4.3 percent, marking the 12th straight year the collective estimates for these offenses declined. Based on the full report in 2014, and with endless news reports documenting increases in homicide and violence in cities throughout the country, we predicted an increase in violent crime for 2015.
2013: Per the FBI, the estimated number of violent crimes in 2013 decreased by 4.4 percent when compared with 2012 figures, and the estimated number of property crimes decreased by 4.1 percent. There were an estimated 1,163,146 violent crimes reported to law enforcement last year, along with an estimated 8,632,512 property crimes. Property crimes decreased 4.1 percent in 2013, marking the 11th straight year the collective estimates for these offenses declined.
2012: The FBI estimated that in 2012 the number of violent crimes increased by 0.7 percent. However, property crimes decreased 0.9 percent, marking the tenth straight year of declines for these offenses, collectively.
National Crime Victimization Survey-Extended Summary of Recent Years-Focus Is On Violent Crime
2022-Violent crime rates increased by 44 percent, the largest crime increase in violent crime rates ever recorded.
Violent and property crime rates were essentially unchanged for 2022-2023 and 2024.
2024: In 2024, the rate of violent victimization in the United States was 23.3 victimizations per 1,000 persons age 12 or older. This rate was higher than the rate in 2020 (16.4 per 1,000 persons) and 2021 (16.5 per 1,000 persons) and was similar to the rate in 2022 and 2023. Victimizations reflect the total number of times that persons or households were victims of crime. There were 6.7 million violent victimizations of persons age 12 or older in the United States in 2024. This was not significantly different from the number in 2023 but was larger than the number of violent victimizations 5 years before, in 2020 (4.6 million). Victimization rates measure the extent to which violent and property victimizations occur in a specified population during a specified time. In 2024, the rate of violent victimization was 23.3 victimizations per 1,000 persons age 12 or older, which was not significantly different from the rate in 2023. There were also no significant changes from 2023 to 2024 in the rates of specific types of violent crime. From 2023 to 2024, there were no statistically significant changes in the rates of domestic violence (violent victimizations that were committed by current or former intimate partners or family members), intimate partner violence (violent victimizations that were committed by current or former spouses, boyfriends, or girlfriends), and stranger violence. Neither violent crime with an injury nor with a weapon changed significantly during this period. However, the rates increased from 2020 to 2024 for intimate partner violence (1.7 per 1,000 persons age 12 and older in 2020 to 2.7 per 1,000 in 2024), violent victimization by a stranger (7.1 to 10.8 per 1,000), and violent victimization with a weapon (3.4 to 5.4 per 1,000). There were 13.1 million property victimizations in 2024, similar to 2023. Households in the United States experienced 13.1 million property victimizations in 2024, which was comparable to the number in 2023 but larger than the number 5 years before, in 2020 (12.1 million).
2023: The rate of nonfatal violent victimization in the United States was 22.5 victimizations per 1,000 persons age 12 or older, which was similar to the 2022 rate of 23.5 violent victimizations per 1,000 persons age 12 or older. Violent victimization includes rape or sexual assault, robbery, aggravated assault and simple assault. “Findings show that there was an overall decline in the rate of violent victimization over the last three decades, from 1993 to 2023,” said Kevin M. Scott, Ph.D., BJS Acting Director. “While the 2023 rate was higher than those in 2020 and 2021, it was not statistically different from the rate 5 years ago, in 2019.” Of the more than 6.4 million violent victimizations in 2023, about 9% involved a firearm, which was not significantly different from the percentage in 2022. Firearm victimizations are violent victimizations where the offender possessed, showed or used a firearm. In 2023, the rate of property victimization was 102.2 per 1,000 households, which was not significantly different from 2022. However, the rate of property victimization in urban areas increased from 176.1 per 1,000 in 2022 to 192.3 per 1,000 in 2023. Property victimization includes burglary or trespassing, motor vehicle theft, and other types of household theft. The NCVS collects information on crimes reported and not reported to police. A smaller percentage of robbery victimizations that occurred in 2023 (42%) than in 2022 (64%) were reported to police, and the percentage of motor vehicle thefts reported to police decreased from 81% in 2022 to 72% in 2023.
2022: The violent victimization rate increased from 16.5 victimizations per 1,000 persons in 2021 to 23.5 per 1,000 in 2022. There were 6.6 million violent victimizations of persons age 12 or older in the United States in 2022, up from 4.6 million in 2021. Many groups (see below) had very large percentage increases in violent victimization. Households in the United States experienced 13.4 million property victimizations in 2022, up from 11.7 million in 2021. The rate of property victimization in 2022 was 101.9 victimizations per 1,000 households, higher than the rate in 2021 (90.3 per 1,000). In 2022, about 2 in 5 (42%) violent victimizations were reported to police. Motor vehicle theft victimization increased from a rate of 4.3 victimizations per 1,000 households in 2021 to 5.5 per 1,000 in 2022. About 10% of violent victimizations involved a firearm in 2022, an increase from 2021 (7%). In 2022, about 1.24% (3.5 million) of persons age 12 or older nationwide experienced at least one violent crime.
2021: From 2020 to 2021, the violent victimization rate increased from 19.0 to 24.5 victimizations per 1,000 persons in urban areas while remaining unchanged in suburban or rural areas. The rate of serious (excluding common assaults) violent victimization in urban areas increased. The overall violent victimization rate did not change between 2020 and 2021. In 2021, about 0.98% (2.7 million) of persons age 12 or older nationwide experienced at least one violent crime. About 6.25% (8.1 million) of households in the country experienced one or more property victimizations (burglary or trespassing, motor vehicle theft, or other household theft). The rate of property victimization in 2021 was 90.3 victimizations per 1,000 households, which was not statistically different from the 2020 rate.
2020: The violent victimization rate dropped 22 percent in 2020. This is the largest decrease in violence ever reported by the Bureau of Justice Statistics (BJS). The violent victimization rate declined from 21.0 per 1,000 persons age 12 or older in 2019 to 16.4 per 1,000 in 2020. The number of violent crimes, excluding simple assault, fell from 2.0 million in 2019 to 1.6 million in 2020.
2019: There was no statistically significant change in number or rate of total violent victimization from 2018 to 2019 including simple assault. The National Crime Victimization Survey states the rate of violent crime excluding simple assault declined 15% for 2019. However, new data from Criminal Victimization-2020 indicates that the numbers and rates for violent crime decreased in 2019, contradicting what they previously said.
2018: Violent Crime: From 2015 to 2018, the total number of violent victimizations increased by 28%. The rate of total violent victimizations also increased. The number of violent incidents increased from 5.2 million in 2017 to 6.0 million in 2018. Property crime continues to decrease. Serious violent crime increased.
2017: For the National Crime Survey (released in December of 2018), most of the sixteen categories of violent crime rates increased from 2015 to 2017. Some were flat. Three decreased. There was no statistically significant increase from 2016 to 2017 in the number of residents who had been victims of violent crime, while there was a statistically significant increase from 2015 to 2017. For the second straight year, the number of victims of violent crime was higher than in 2015. The number of persons age 12 or older who had been victims of violent crime rose from 2.7 million in 2015 to 2.9 million in 2016 (up 9 percent from 2015) and 3.1 million in 2017 (up 17 percent from 2015). The 2-year increase in the number of violent-crime victims was 455,700.
2016: Based on revised estimates (released on October 18, 2018) from the National Crime Victimization Survey, from 2015 to 2016, violent criminal victimizations increased for a variety of categories. Property crime increased for the first time since 2013. The revised estimates replace previously released 2016 estimates that did not permit year-to-year comparisons. From 2015 to 2016, the number of persons experiencing one or more violent victimizations increased from 2.7 million to 2.9 million. From 2015 to 2016, the number of violent crimes increased from 5,006,620 to 5,353,820. There was no statistically significant change in the rate of overall violent crime from 2015, yet the rate increased (18.6 victimizations per 1,000 persons age 12 or older) to 2016 (19.7 per 1,000).
2015: There was no statistically significant change in the overall rate of violent crime, per the Bureau of Justice Statistics (BJS). The rate of violent victimization was 18.6 victimizations per 1,000 persons age 12 or older in 2015.
2014: Violent crime rates decreased from 2013 (23.2 victimizations per 1,000) to 20.1 per 1,000 in 2014. The overall property crime rate (which includes household burglary, theft, and motor vehicle theft) decreased from 131.4 victimizations per 1,000 households in 2013 to 118.1 victimizations per 1,000 in 2014.
In 2013: The overall violent crime rate declined slightly from 26.1 to 23.2 victimizations per 1,000 U.S. residents from 2012 to 2013, per the Justice Department’s Bureau of Justice Statistics (BJS). The violent crime rate had declined for nearly two decades before increasing in 2011 and 2012. The overall property crime rate, which includes burglary, theft, and motor vehicle theft, also decreased after two consecutive years of increases. From 2012 to 2013, the rate declined from 155.8 to 131.4 victimizations per 1,000 U.S. households.
In 2012: For the second consecutive year, violent and property crime rates increased. The overall violent crime rate (which includes rape or sexual assault, robbery, and aggravated and simple assault) rose from 22.6 victimizations per 1,000 persons in 2011 to 26.1 in 2012.
15.
Links For The Latest Data Involving Crimes Reported To Law Enforcement Agencies (through the FBI), Including FBI Press Releases
Note: Crime Data From The FBI Is Now Located In Their New National Crime Data Explorer.
- FBI Press Release for 2025
- FBI Press Release for 2024
- FBI Press Release for 2023
- FBI Press Release for 2022
- FBI Press Release for 2021
- FBI Final Crime Statistics for 2020
- https://www.fbi.gov/news/pressrel/press-releases/overview-of-preliminary-uniform-crime-report-january-june-2020
- https://www.fbi.gov/news/pressrel/press-releases/fbi-releases-2019-crime-statistics
- https://www.fbi.gov/news/stories/2018-crime-statistics-released-093019
- https://www.fbi.gov/news/pressrel/press-releases/fbi-releases-preliminary-semiannual-crime-statistics-for-2018
- https://www.fbi.gov/news/pressrel/press-releases/fbi-releases-2017-crime-statistics
- https://www.fbi.gov/news/stories/2017-preliminary-semiannual-crime-stats-released
- https://www.fbi.gov/news/pressrel/press-releases/fbi-releases-2016-crime-statistics
- https://ucr.fbi.gov/about-us/cjis/ucr/crime-in-the-u.s/2016/preliminary-semiannual-uniform-crime-report-januaryjune-2016
- https://ucr.fbi.gov/crime-in-the-u.s/2015/crime-in-the-u.s.-2015/resource-pages/2015-cius-summary_final
- https://www.fbi.gov/news/pressrel/press-releases/fbi-releases-preliminary-semiannual-crime-statistics-for-2015
- https://www.fbi.gov/news/pressrel/press-releases/fbi-releases-2014-crime-statistics
- http://www.fbi.gov/about-us/cjis/ucr/crime-in-the-u.s/2014/preliminary-semiannual-uniform-crime-report-january-june-2014
- http://www.fbi.gov/news/pressrel/press-releases/fbi-releases-2013-crime-statistics
- http://www.fbi.gov/about-us/cjis/ucr/crime-in-the-u.s/2012/crime-in-the-u.s.-2012/fbi-releases-2012-crime-statistics
- http://www.fbi.gov/about-us/cjis/ucr/crime-in-the-u.s/2011/crime-in-the-u.s.-2011/fbi-releases-2011-crime-statistics
Links For The Latest Data From The National Crime Victimization Survey
- The complete list of the “Criminal Victimization” series (1993 to today) is available at the Bureau of Justice Statistics.
See More
See more articles on crime and justice at Crime in America.
Most Dangerous Cities/States/Countries at Most Dangerous Cities.
US Crime Rates at Nationwide Crime Rates.
National Offender Recidivism Rates at Offender Recidivism.
The Crime in America.Net RSS feed (https://crimeinamerica.net/?feed=rss2) provides subscribers with a means to stay informed about the latest news, publications, and other announcements from the site.
Very helpful information to be used in my Introduction to the Administration of Justice class.
I am working on a dissertation and was wondering if there is a graph which goes back into the 30’s or 40’s and charts the crime rate in America up to 2010? Any suggestions?
Thank you for your help!
Sid
Hi Sid: Thanks for the question: The FBI started collecting crime data in the 30’s. Please contact them through the links provided in the section you were reading.
The alternative is homicide data collected by federal public health agencies. If the FBI does not work out, let me know.
Best, Adam.
im doing a research paper over crime rates and if you have any information on anything that may help me plz message me
Please look at the categories at the top of the site for “crime in the US.”
Thanks, Adam.